If you're of the opinion that AI isn't going to solve all the world's problems, you're probably right. And if you think it could, well, you might be onto something too.
In the world of software engineering, particularly observability, where complexity often outpaces comprehension, AI isn't just a fancy tool; it's becoming an inevitable necessity.
During the Grafana Hackathon, the Pyroscope team embraced this reality. We tackled a genuine challenge head-on with AI: making flamegraph analysis intuitive, even for those new to profiling.
We've seen that AI excels at tasks like language interpretation. So, why not leverage it to demystify flamegraphs? This led us to our Hackathon mission:
Demonstrate how AI can transform the user experience in analyzing and interpreting flamegraphs.
We did this by giving humans and AI the same flamegraph and asking them to interpret it as shown below. We then compared the results and analyzed the differences.
A Direct Challenge: How Well Can You Interpret This Flamegraph?#
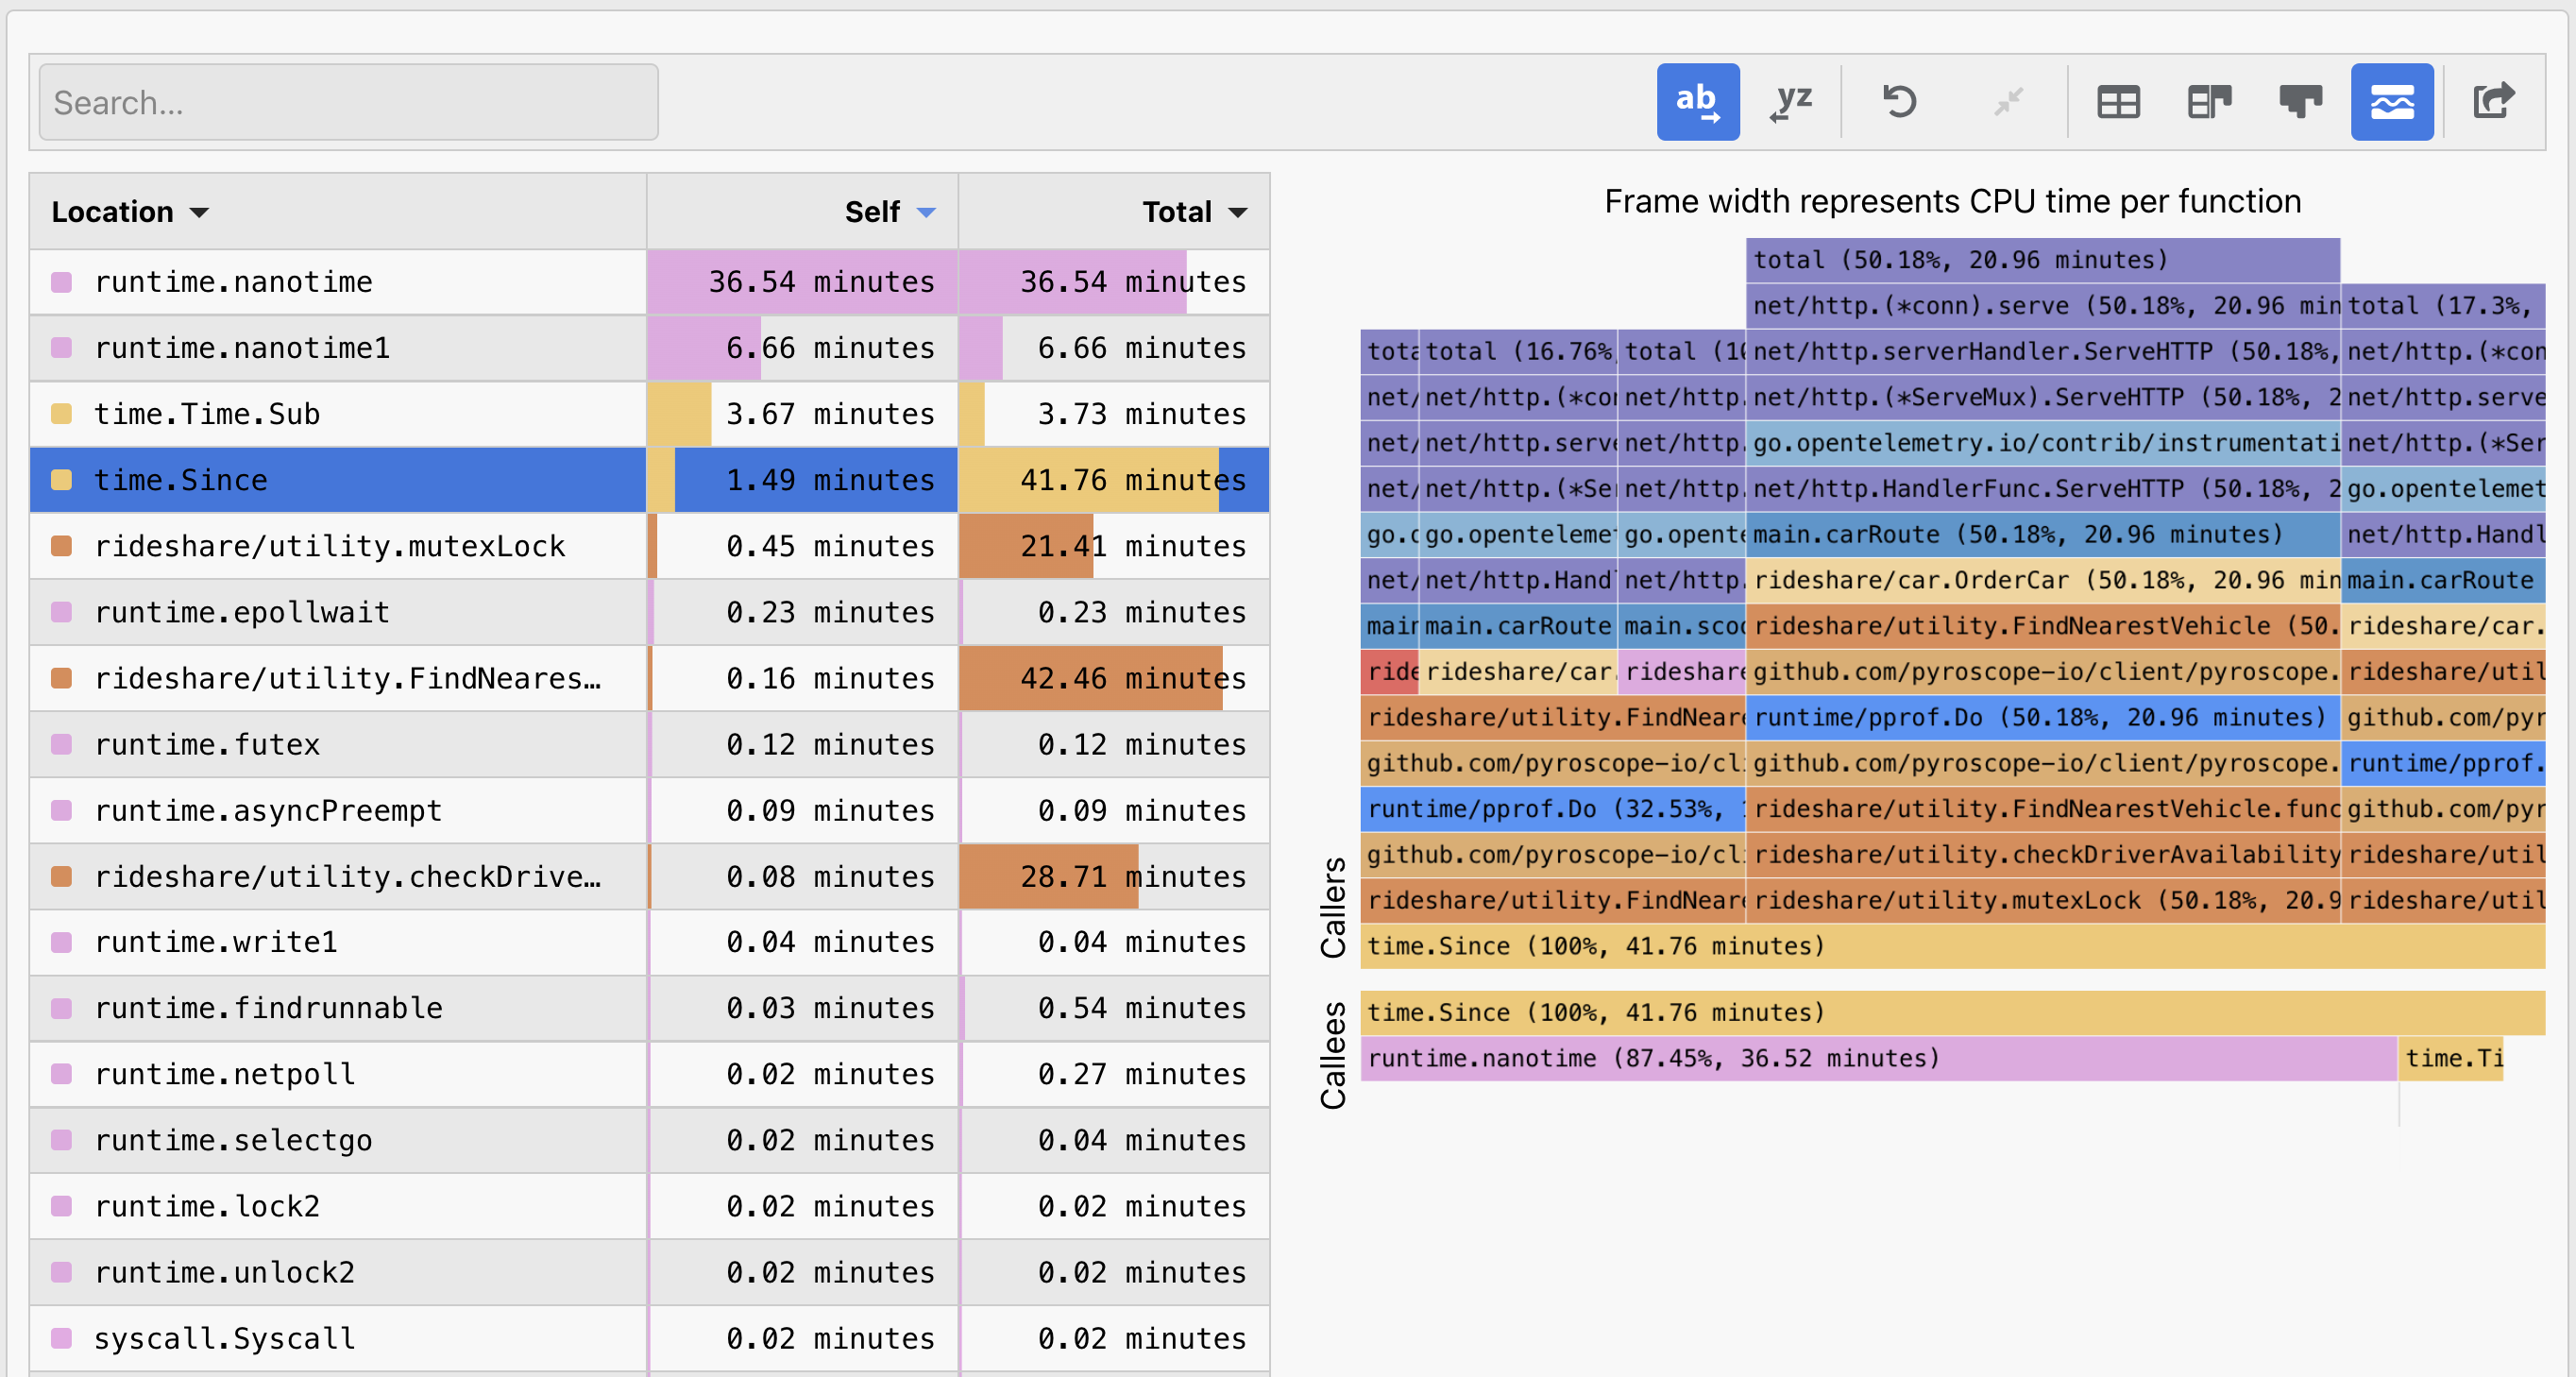
Before diving into AI’s capabilities, let's set a baseline. Here’s a flamegraph for you to analyze. See if you can answer these key profiling questions:
- Performance Bottleneck: What's causing the slowdown?
- Root Cause: Why is it happening?
- Recommended Fix: How would you resolve it?
This is where many face challenges, particularly beginners. But understanding these flamegraphs is key to simplifying the code that powers them.
AI’s Flamegraph Interpretation: An Eye-Opening Comparison#
Now for the fun part: let's see how our AI interprets this same flamegraph. We use a prompt that is roughly equivalent to the questions above.
Click the button to see the AI's interpretation of the flamegraph below#
It was given a similar prompt to the questions above:
interpret this flamegraph for me and answer the following three questions:- **Performance Bottleneck**: What's slowing things down?- **Root Cause**: Why is this happening?- **Recommended Fix**: How can we resolve it?
[ ... specially compressed flamegraph data ]How does its analysis stack up against yours? Statistically it probably did either better or worse than you (obviously)...
Bots vs. Brains: Who's better at Flamegraph Interpretation?#
We didn't stop at theoreticals. We put AI to a real-world test, sending the same flamegraph to a diverse group of individuals, categorizing them by their expertise in flamegraph analysis, and comparing their responses to AI's.
Distribution of participants by skill level:#
The Results Are In: AI is better than (most) humans at interpreting flamegraphs#
Flamegraph Experts: Score: 83% passed. They demonstrated high accuracy and detailed understanding, quickly pinpointing issues and interpreting them correctly
Flamegraph Advanced: Score: 70% passed. Their responses varied, some were spot on while others often didn't dig far enough into the flamegraph to identify the root cause
Non-Technical Professionals: Score: 23% passed. This group most frequently took thie
idkoption on especially the root cause and recommended fix question -- some very entertaining guesses though!AI Interpreter: Pass Score: 100% (10 iterations with same prompt). The AI consistently outperformed
beginnersandadvancedusers, providing accurate, albeit less detailed/nuanced, interpretations than theexperts.
These initial results at least point towards a great opportunity in adding value to most users by incorporating AI.
We will definitely be exploring this further via more formal testing and would love to hear your thoughts on this as well -- where do you see it fitting in best to your workflow?
AI in Pyroscope: A clear win for UX#
While we still have the rest of the week to tweak our project for the Hackathon, what we've learned so far is that AI's strength lies not just in analysis but more importantly in "filling the gaps" by augmenting and enhancing user experience no matter what level you're at.
It only takes using a flamegraph successfully once to really move from the beginner to advanced category. The thing is, from a product standpoint our biggest challenge has been building a user-experience that can span from beginner to expert and still be useful for both.
However, with just a little bit of prompt engineering we can use AI to bridge this gap and provide and endless array of tailored experiences for each user.
AI Tailored Responses for Diverse User Needs#
Explain the flamegraph to a beginner with no flamegraph knowledge...#
Explain the flamegraph in the form of a HN thread...#
Explain the flamegraph in the form of IT department humor...#
Explain the flamegraph in the form of a poem...#
Explain the flamegraph in the form of a Michael Scott quote...#
Whether you're a beginner, an expert, or just someone bored at work trying to find an entertaining way to do an otherwise boring task -- all it takes is a little prompt engineering to tune the experience to your liking.
With just a few lines of code we can adjust these prompts (or allow users to adjust them) to guide everyone from beginner to expert.
Your Turn: Test AIs analysis of your code!#
It's worth noting that, the flamegraph used for this post is a current representation of our distributor. As you can see, our distributors have bottlnecks in two notorious tasks that most companies are likely not doing perfectly either: regular expressions which is technically the bottlneck, but compression/parsing is also an acceptable answer for bottlneck (fixes comoing soon!).
However, while AI was successful in analyzing this particular flamegraph, there are probably 51,331,542 more cases where AI fails (or succeeds) spectacularly and we'd love for you to find and share real examples with us!
How to use our AI-powered flamegraph interpreter on your own flamegraphs#
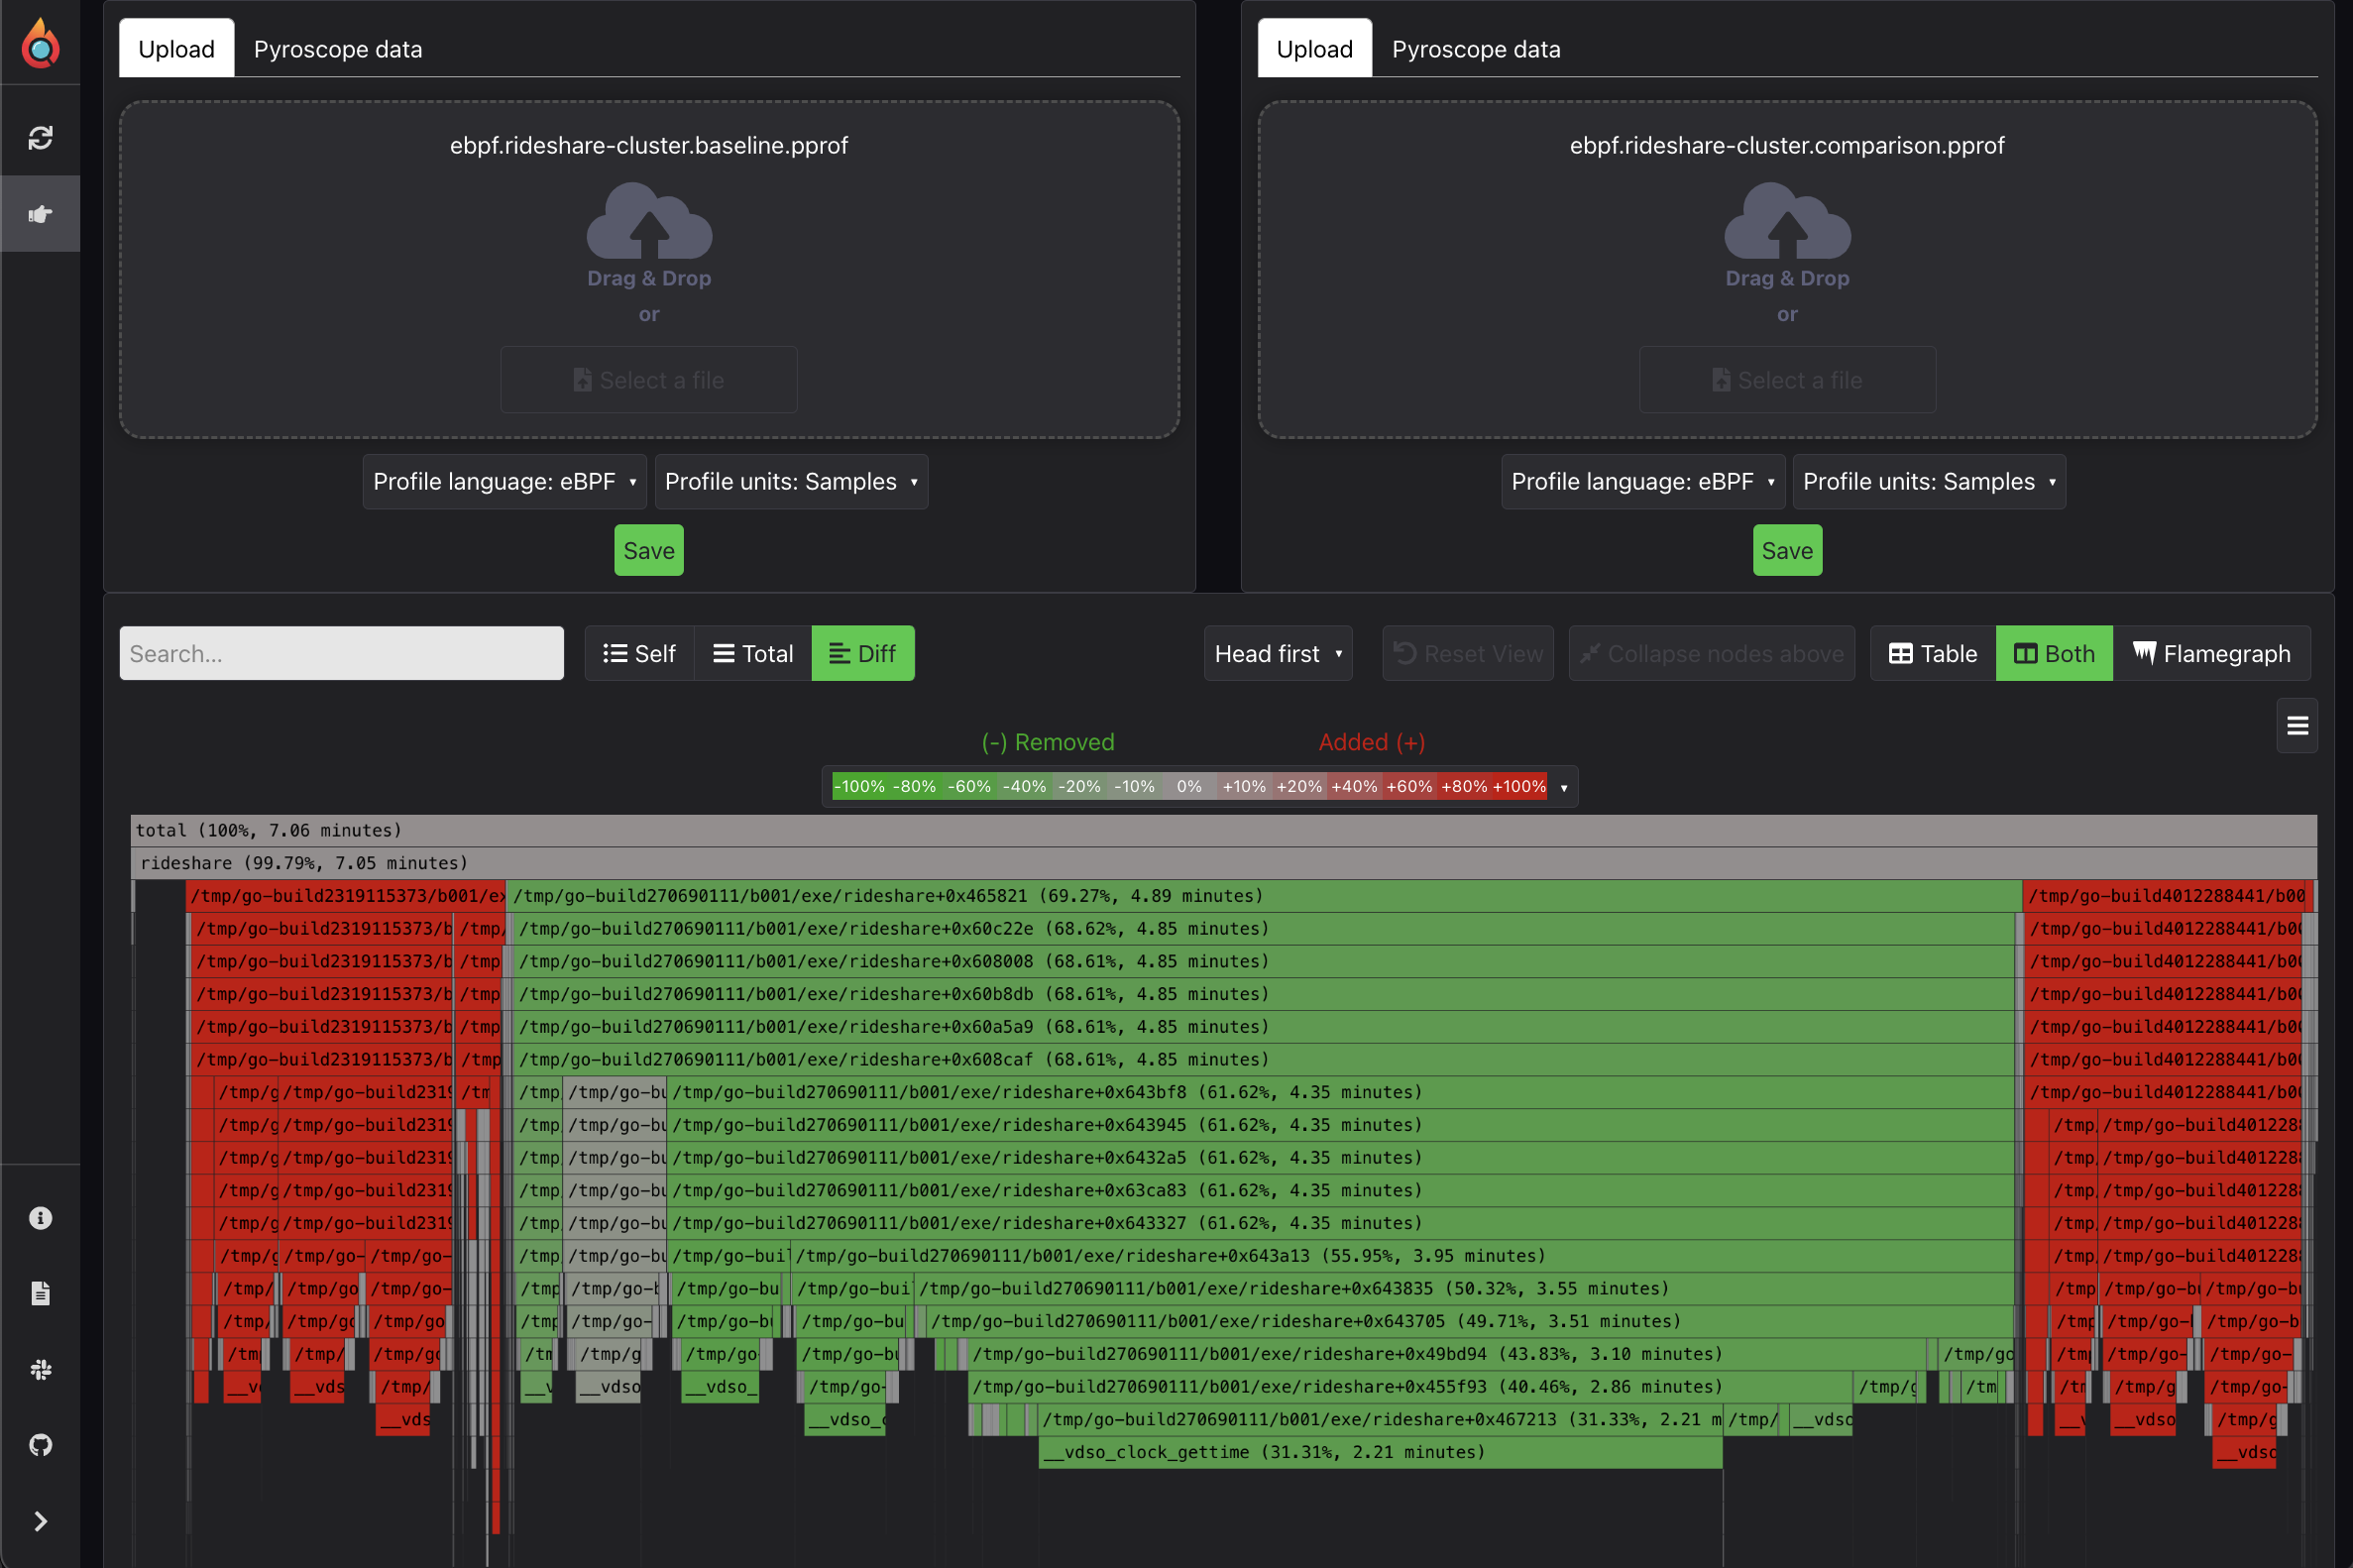
Option 1: Upload pprof to Flamegraph.com#
Upload pprof file containing one flamegraph to flamegraph.com and click the "ai explainer" button.
You can get a pprof file from most easily from Go runtime, but Pyroscope exports pprof from all languages via the export button.
Note: You do have to export pprof format specifically and upload to flamegraph.com separately; exporting directly to flamegraph.com via the flamegraph.com button will not (yet) work
Option 2: View flamegraph in Grafana Cloud (coming soon):#
Send profiling data to Grafana Cloud Profiles and look at the Cloud profiles app (you can sign up for a free account) and click the "ai explainer" button
Option 3: Wait a bit...#
Wait until we release an open source version of this tool (pending positive feedback from the community)
All feedback / ideas welcome!#
Let us know the good, bad and ugly of your experience with AI-powered flamegraph analysis:
- On Twitter: @PyroscopeIO and let the world know how you're using AI in flamegraph analysis.
- On Slack: Join the conversation in our community channel
- On GitHub: Feel free to add to the discussion to share detailed feedback or suggest enhancements
Appendix#
In case you were wondering how we clasified peopel into groups we had them self categorize on the following scale:
- Flamegraph Experts: Comprising experienced software engineers and DevOps engineers who have used flamegraphs before
- Flamegraph Advanced: Junior developers, technical support staff, frontend engineers, or other engineers new to Pyroscope or continuous profiling tools
- Non-Technical Professionals: From sales, marketing, HR, and project management, know their way around observability tooling but seldom if ever directly involved in coding or debugging