Using flame graphs to get to the root of the problem#
I know from personal experience that debugging performance issues on Python servers can be incredibly frustrating. Usually, increased traffic or a transient bug would cause end users to report that something was wrong.
More often than not, it's impossible to exactly replicate the conditions under which the bug occured, and so I was stuck trying to figure out which part of our code/infrastructure was responsible for the performance issue on our server.
This article explains how to use flame graphs to continuously profile your code and reveal exactly which lines are responsible for those pesky performance issues.
Why You should care about CPU performance#
CPU utilization is a metric of application performance commonly used by companies that run their software in the cloud (i.e. on AWS, Google Cloud, etc).
In fact, Netflix performance architect Brendan Gregg mentioned that decreasing CPU usage by even 1% is seen as an enormous improvement because of the resource savings that occur at that scale. However, smaller companies can see similar benefits when improving performance because regardless of size, CPU is often directly correlated with two very important facets of running software:
- How much money you're spending on servers - The more CPU resources you need, the more it costs to run servers
- End-user experience - The more load placed on your server's CPUs, the slower your website or server becomes
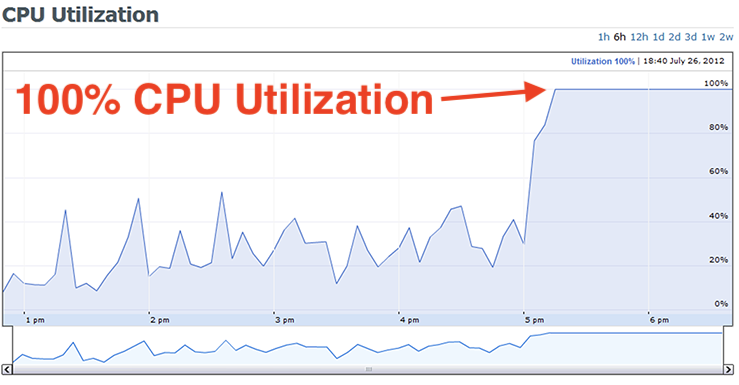
So when you see a graph of CPU utilization that looks like this:

During the period of 100% CPU utilization, you can assume:
- End-users are having a frustrating experience (i.e. App / Website is loading slow)
- Server costs will increase after you provision new servers to handle the additional load
The question is: which part of the code is responsible for the increase in CPU utilization? That's where flame graphs come in!
How to use flame graphs to debug performance issues (and save $66,000 on servers)#
Let's say the flame graph below represents the timespan that corresponds with the "incident" in the picture above where CPU usage spiked. During this spike, the server's CPUs were spending:
- 75% of time in
foo() - 25% of time in
bar() - $100,000 on server costs

You can think of a flame graph like a super detailed pie chart, where:
- The width of the flame graph represents 100% of the time range
- Each node represents a function
- The biggest nodes are taking up most of the CPU resources
- Each node is called by the node above it
In this case, foo() is taking up 75% of the total time range, so we can improve foo() and the functions it calls in order to decrease our CPU usage (and save $$).
Creating a flame graph and Table with Pyroscope#
To recreate this example with actual code, we'll use Pyroscope - an open-source continuous profiler that was built specifically for debugging performance issues. To simulate the server doing work, I've created a work(duration) function that simulates doing work for the duration passed in. This way, we can replicate foo() taking 75% of time and bar() taking 25% of the time by producing this flame graph from the code below:

# where each iteration simulates CPU timedef work(n):    i = 0    while i < n:        i += 1
# This would simulate a CPU running for 7.5 secondsdef foo():    work(75000)
# This would simulate a CPU running for 2.5 secondsdef bar(): work(25000)Then, let's say you optimize your code to decrease foo() time from 75000 to 8000, but left all other portions of the code the same. The new code and flame graph would look like:

# This would simulate a CPU running for 0.8 secondsdef foo():    # work(75000)    work(8000)
# This would simulate a CPU running for 2.5 secondsdef bar(): work(25000)Improving foo() saved us $66,000#
Thanks to the flame graphs, we were able to identify immediately that foo() was the bottleneck in our code. After optimizing it, we were able to significantly decrease our cpu utilization.

This means your total CPU utilization decreased 66%. If you were paying $100,000 dollars for your servers, you could now manage the same load for just $34,000.