7 posts tagged with "profiling"

View All Tags

· 3 min read

Stop screenshotting Flamegraphs and start embedding them#

Typically a flamegraph is most useful when you're able to click into particular nodes or stack traces to understand the program more deeply. After several blog posts where we featured flamegraphs as a key piece of the posts we found that screenshotting pictures of flamegraphs was missing this key functionality compared to being able to interact with flamegraphs.

As a result, we created flamegraph.com to have a place where users can upload, view, and share flamegraphs.

We recently released an update to flamegraph.com that makes it easy to embed flamegraphs in your blog or website. The steps to embed a flamegraph are:

  1. Upload a flamegraph or flamegraph diff to flamegraph.com
  2. Click the "Embed" button
  3. Copy the "Copy" button to copy the embed code snippet
  4. Paste the embed code snippet into your blog or website

clicking_embed_button_high_res

· 6 min read
warning

Pyroscope is now part of Grafana Labs! As a result we have consolidated efforts around our Grafana plugins to make one recomended way of using Pyroscope. As a result this blogpost is now outdated. However, you can find updated docs on how to add profiling to Grafana with Pyroscope using the Grafana profiling documentation.

Grafana is an open-source observability and monitoring platform used by individuals and organizations to monitor their applications and infrastructures. Grafana leverages the three pillars of observability, metrics, logs, and traces, to deliver insights into how well your systems are doing. Nowadays, Observability involves a whole lot more than metrics, logs, and tracing; it also involves profiling.

In this article, I will:

  1. Describe how to leverage continuous profiling in Grafana by installing the Pyroscope flamegraph panel and datasource plugin
  2. Show how to configure the plugins properly
  3. Explain how to setup your first dashboard that includes profiling
  4. Give a sneak peak of an upcoming feature that will let you link profiles to logs, metrics, and traces

If you're new to flamegraphs and would like to learn more about what they are and how to use them, see this blog post.

Introduction#

pillars-of-observability-complete

Grafana provides you with tools to visualize your metrics, view logs, and analyze traces, but it is incomplete without the added benefits of profiling. Continuous Profiling is super critical when you’re looking to debug an existing performance issue in your application. It enables you to monitor your application’s performance over time and provides insights into parts of your application that are consuming resources the most. Continuous profiling is used to locate and fix memory leaks, clean up unused code, and understand the call tree of your application. This results in a more efficient application.

Benefits of using Pyroscope in Grafana#

Unified view for complete observability#

Using Pyroscope in Grafana provides you with complete observability without leaving your Grafana dashboard. Grafana leverages the powerful features of Pyroscope to take complete control of your application’s end-to-end observability and makes things like debugging easy. You can now see your profiles alongside corresponding logs, metrics, and traces to tell the complete story of your application.

Zero migration cost#

It costs nothing to migrate your application profile from Pyroscope’s UI dashboard into Grafana. Simply open Grafana and install both the Pyroscope panel and datasource plugin, and you’re all set!

left-right: flamegraph in Pyroscope, flamegraph in Grafana

· 6 min read

Introduction#

In this article, I will introduce you to flamegraphs, how to use them, how to read them, what makes them unique, and their use cases.

What is a flamegraph#

A flamegraph is a complete visualization of hierarchical data (e.g stack traces, file system contents, etc) with a metric, typically resource usage, attached to the data. Flamegraphs were originally invented by Brendan Gregg. He was inspired by the inability to view, read, and understand stack traces using the regular profilers to debug performance issues. The flamegraph was created to fix this exact problem.

Flamegraphs allow you to view a call stack in a much more visual way. They give you insight into your code performance and allow you to debug efficiently by drilling down to the origin of a bug, thereby increasing the performance of your application.

· 5 min read

Coming from a background working as a frontend developer at Grafana I'm no stranger to open source performance monitoring. I was part of a team that was responsible for the overall user experience of Grafana and performance was one of the key considerations. Along the line, I learned about a debugging technique known as profiling for monitoring application performance and fell in love ever since.
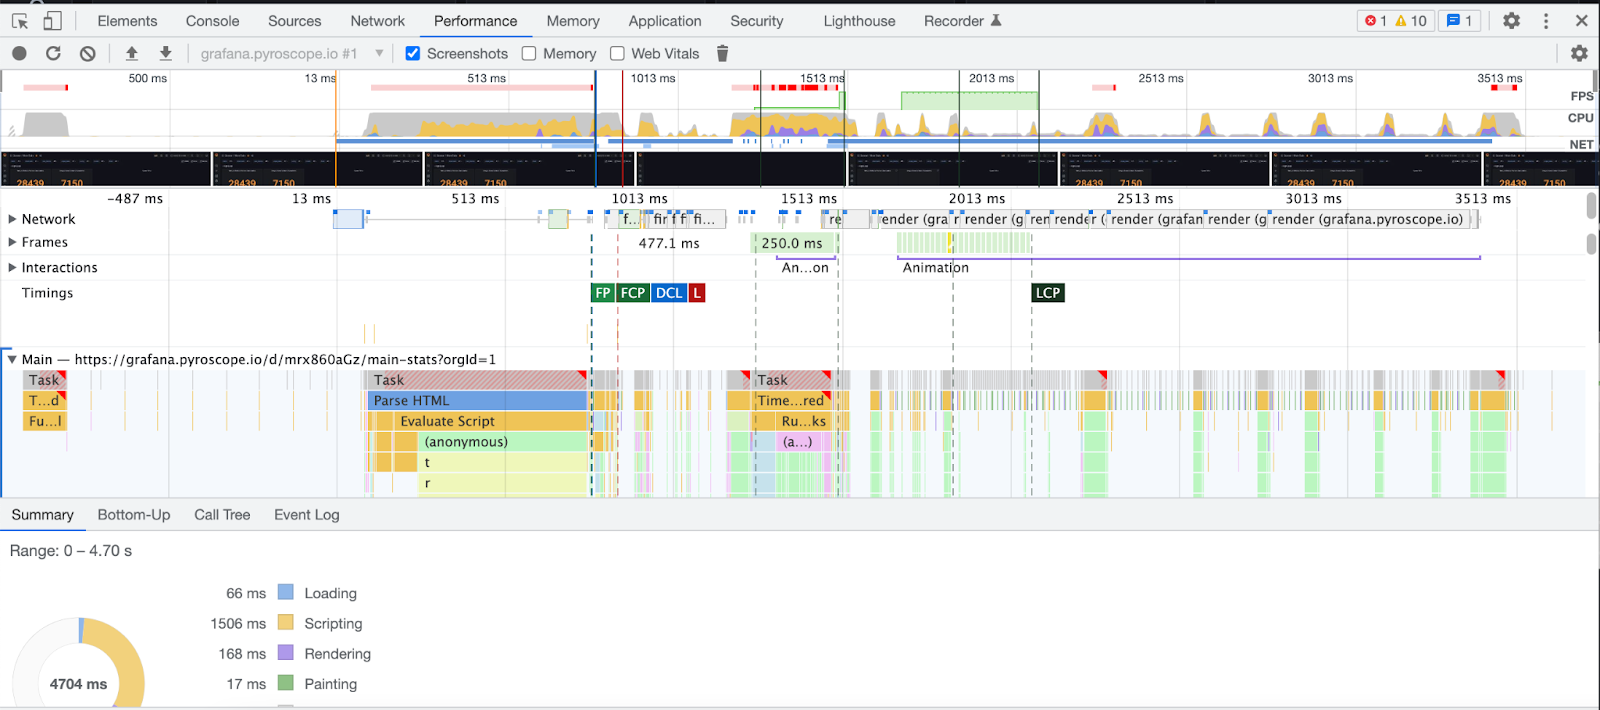
chrome browser profiler

What is continuous profiling#

“Profiling” is a dynamic method of analyzing the complexity of a program, such as CPU utilization or the frequency and duration of function calls. With profiling, you can locate exactly which parts of your application are consuming the most resources. “Continuous profiling” is a more powerful version of profiling that adds the dimension of time. By understanding your system's resources over time, you can then locate, debug, and fix issues related to performance.

As a frontend developer, my experience with profiling was limited to the browser. However, in the course of my study, I discovered a new pattern of profiling that seems exciting– continuous profiling. Similar to how you use the profiler in the dev console to understand frontend performance issues, continuous profiling allows you to profile servers from various languages 24/7 and be able to understand resource usage at any particular time.

While continuous profiling is new to many, the concept is actually relatively old. In 2010, Google released a paper titled “Google Wide profiling: A continuous profiling infrastructure for data centers” where they make the case for the value of adding continuous profiling to your applications.

Industry traction for continuous profiling#

Since then, many major performance monitoring solutions have joined them in releasing continuous profiling products. As time has gone on, the continuous profiling space has been getting increasingly popular as various companies/VCs are more frequently making major investments in Continuous Profiling to keep up with demand for this type of monitoring.
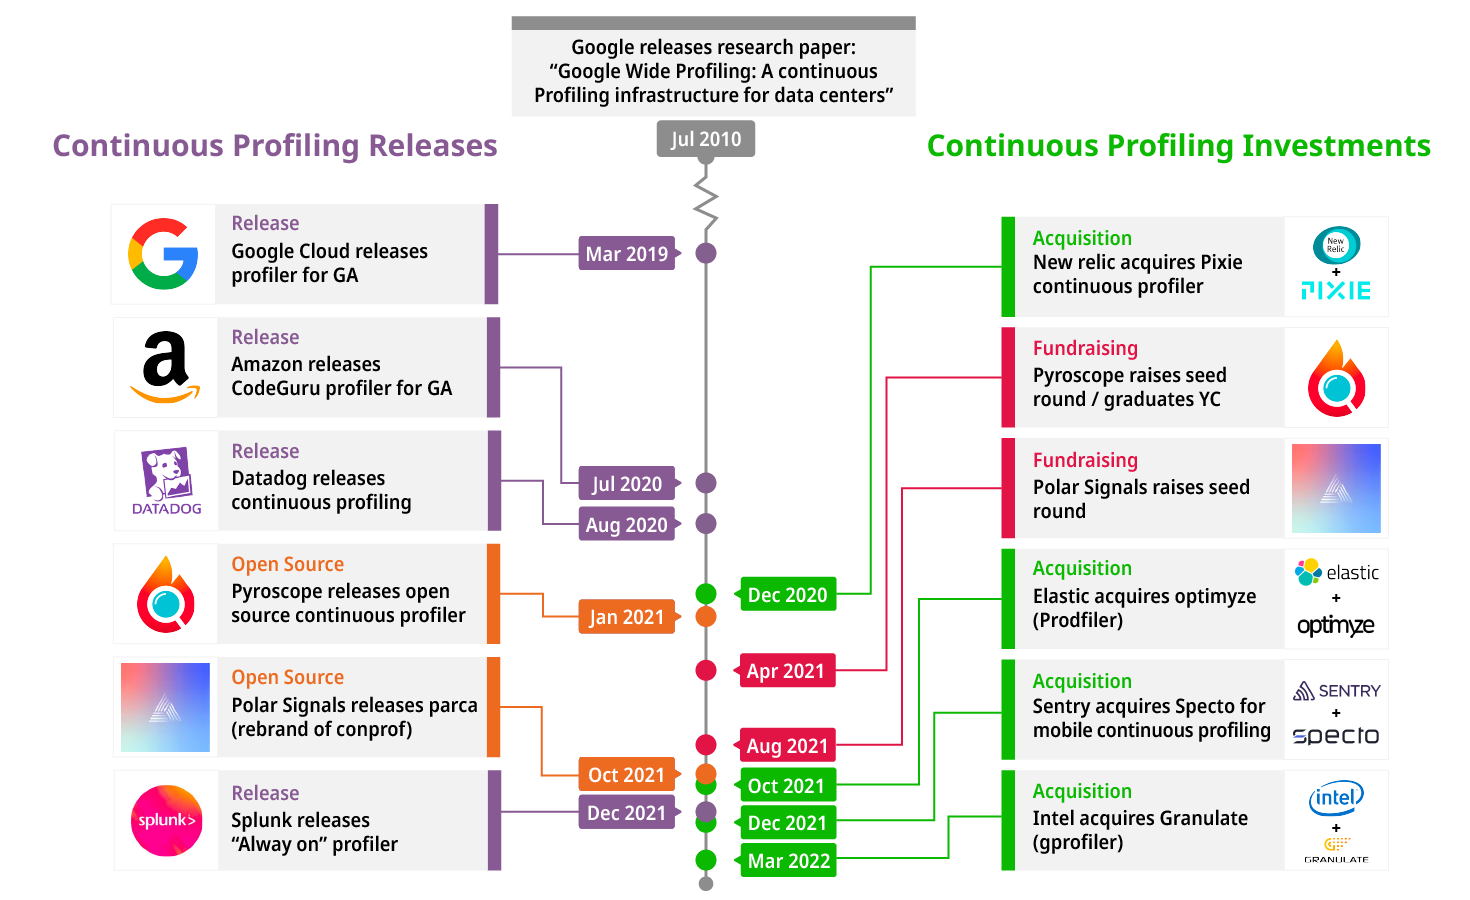
continuous profiling trends

· 4 min read

image

Why we added adhoc profiling#

While most profilers are built for more static or adhoc analysis (ie.profiling a script), Pyroscope's continuous profiling gives you the opportunity to jump around to any point in time. This fluid profiling is beneficial for understanding performance issues in your application. However, as we continued to improve on Pyroscope UI/UX, we identified ideal situations to use static profiling instead of running a profiler continuously, including profiling scripts and attaching a running process.

Our goal is to make Pyroscope a one-stop-shop for all profiling needs. That means supporting all languages, all flamegraph formats, continuously profiling servers, and, of course, quickly profiling an adhoc script.

Introducing Adhoc profiling#

That being said, we are excited to officially release Adhoc profiling mode for Pyroscope! With adhoc mode, you get all the convenience and simplicity of profiling a script, as well as Pyroscope's stellar visualization and UI functionality.

· 6 min read

How we improved performance of our Go application#

Recently we released a new feature where users can run Pyroscope in pull mode. It allows you to pull profiling data from applications and it has various discovery mechanisms so that you can easily integrate with things like kubernetes and start profiling all of your pods with minimum setup.

For Pyroscope, the difference between push and pull mode is that:

  • Push mode: Sends a POST request with profiling data from the application to the Pyroscope server and return a simple response
  • Pull mode: Pyroscope sends a GET request to targets (identified in config file) and the targets return profiling data in the response.

push_vs_pull_diagram_07