

Why we added adhoc profiling#
While most profilers are built for more static or adhoc analysis (ie.profiling a script), Pyroscope's continuous profiling gives you the opportunity to jump around to any point in time. This fluid profiling is beneficial for understanding performance issues in your application. However, as we continued to improve on Pyroscope UI/UX, we identified ideal situations to use static profiling instead of running a profiler continuously, including profiling scripts and attaching a running process.
Our goal is to make Pyroscope a one-stop-shop for all profiling needs. That means supporting all languages, all flamegraph formats, continuously profiling servers, and, of course, quickly profiling an adhoc script.
Introducing Adhoc profiling#
That being said, we are excited to officially release Adhoc profiling mode for Pyroscope! With adhoc mode, you get all the convenience and simplicity of profiling a script, as well as Pyroscope's stellar visualization and UI functionality.
Exporting interactive Flamegraph HTML from Pyroscope Adhoc mode#
You can use the pyroscope adhoc command to profile a script and export the HTML file for an interactive profile that you can view, play with, and share with your team.
For example, to profile a Golang script like this one you simply run:
pyroscope adhoc go run adhoc-push.gowhich will produce a folder containing an .html file with an interactive flamegraph for each of the pprof profiles.

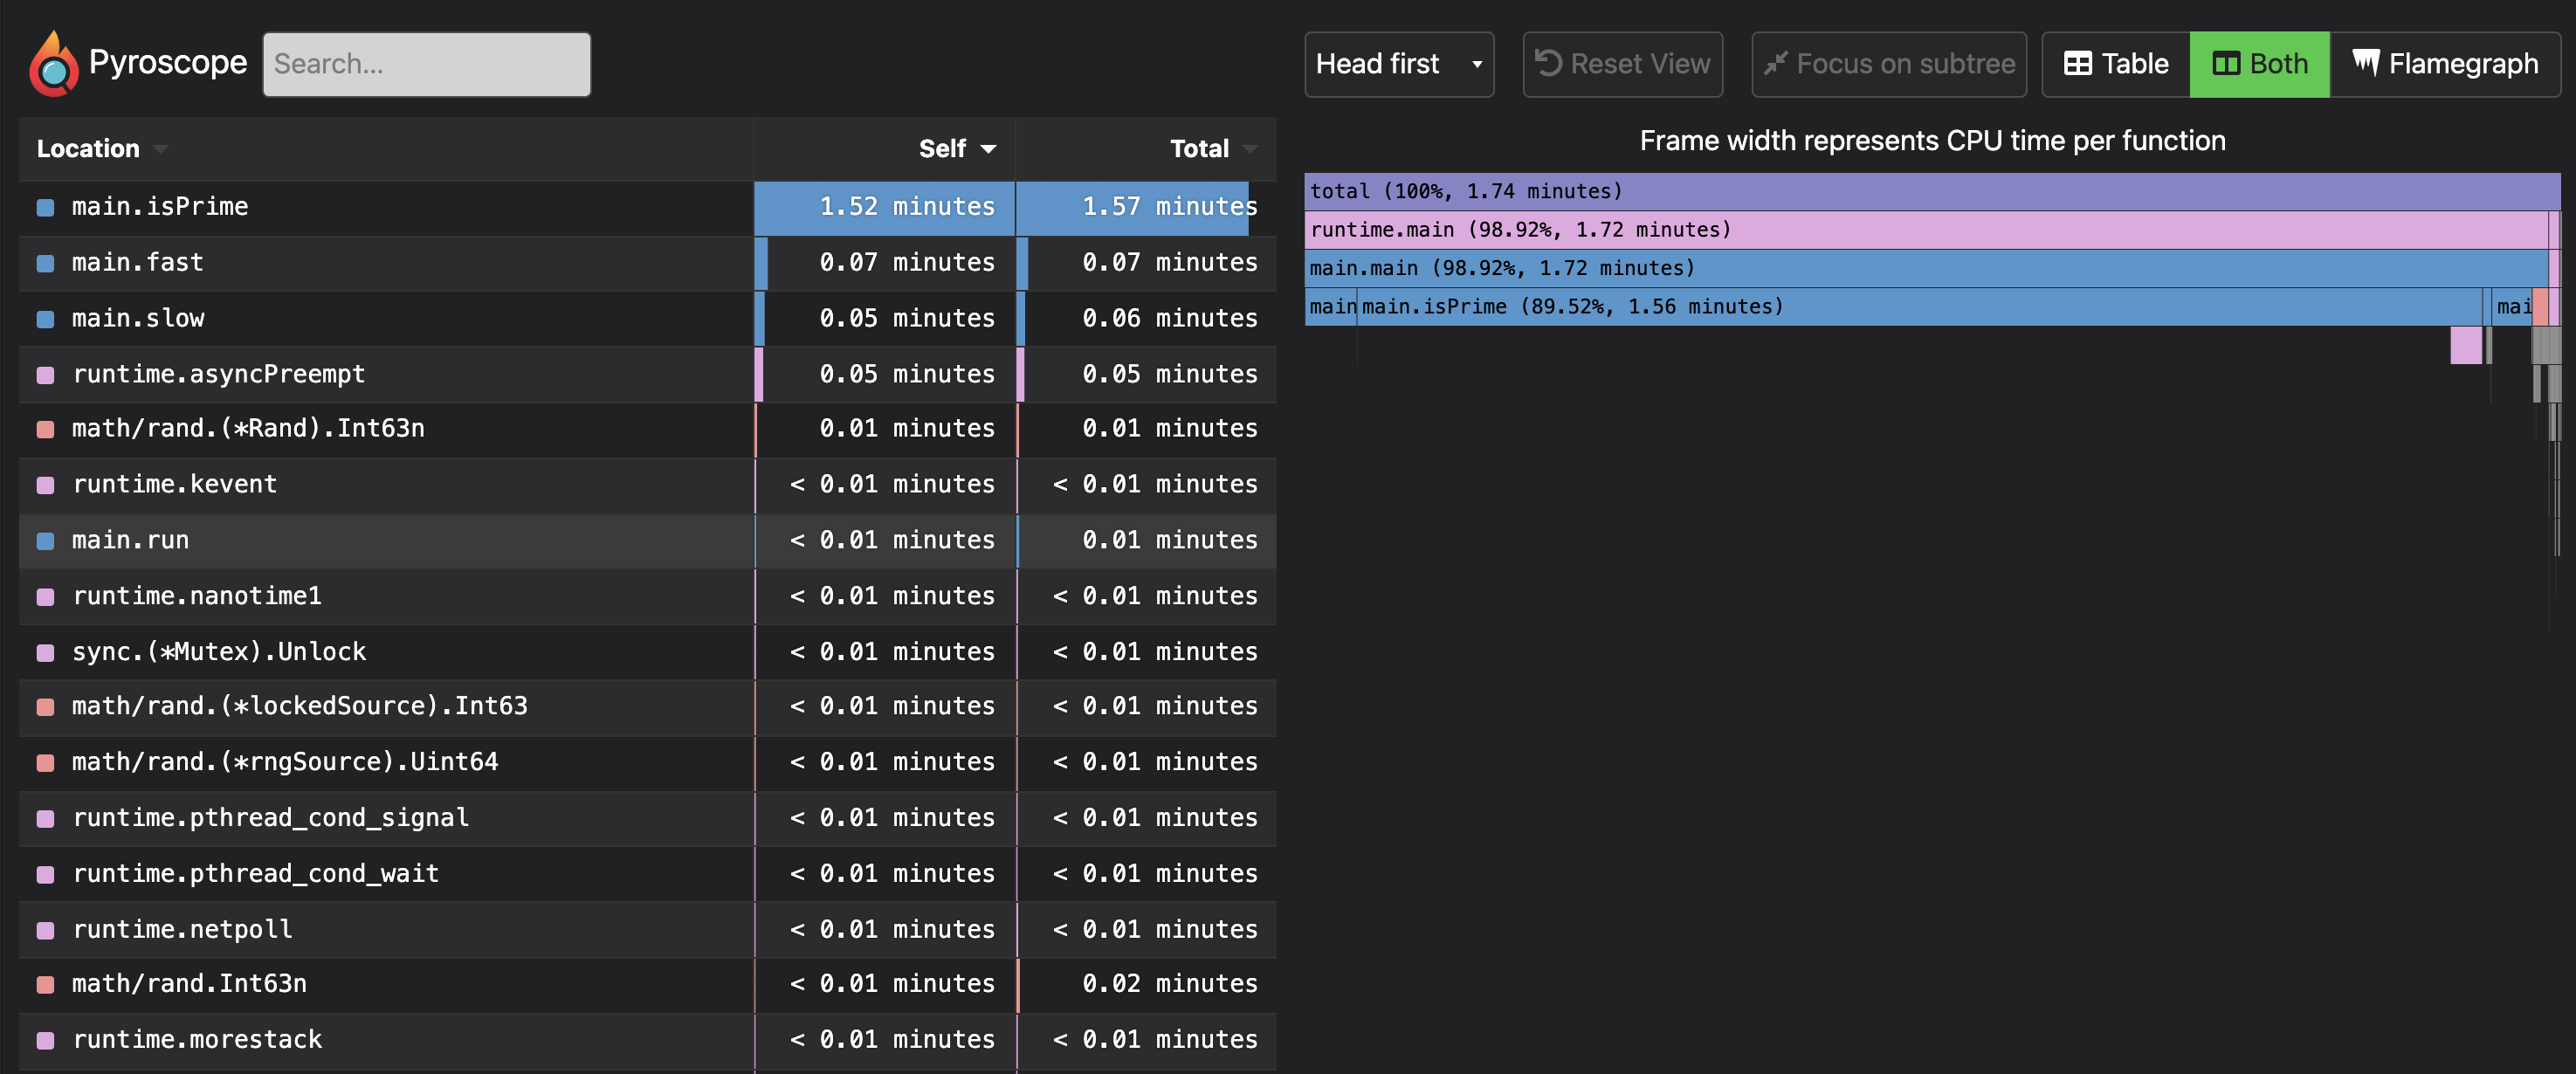
This command will profile the file passed in and then export an HTML file that looks like the Pyroscope UI, but it is exported as a simple standalone HTML file:
Note: This HTML export can also be achieved through the file exported dropdown available in the flamegraph toolbar of your continuous profiling flamegraphs:

This is the simplest way to use Pyroscope adhoc mode. The new feature is great for quickly viewing and sharing profiles in a format with more functionality than a simple screenshot.
Analyzing Pyroscope-generated Adhoc Flamegraphs#
HTML file export allows you to easily share profiles with other people. Pyroscope also permanently stores all of your profiles in the ~/.pyroscope/ directory so you can revisit or compare profiles. In order to do that, run:
Pyroscope stores data in the ~/.pyroscope/ directory. If you run:
pyroscope serverAnd go to port :4040 to access the flamegraphs you have created via the pyroscope adhoc command.

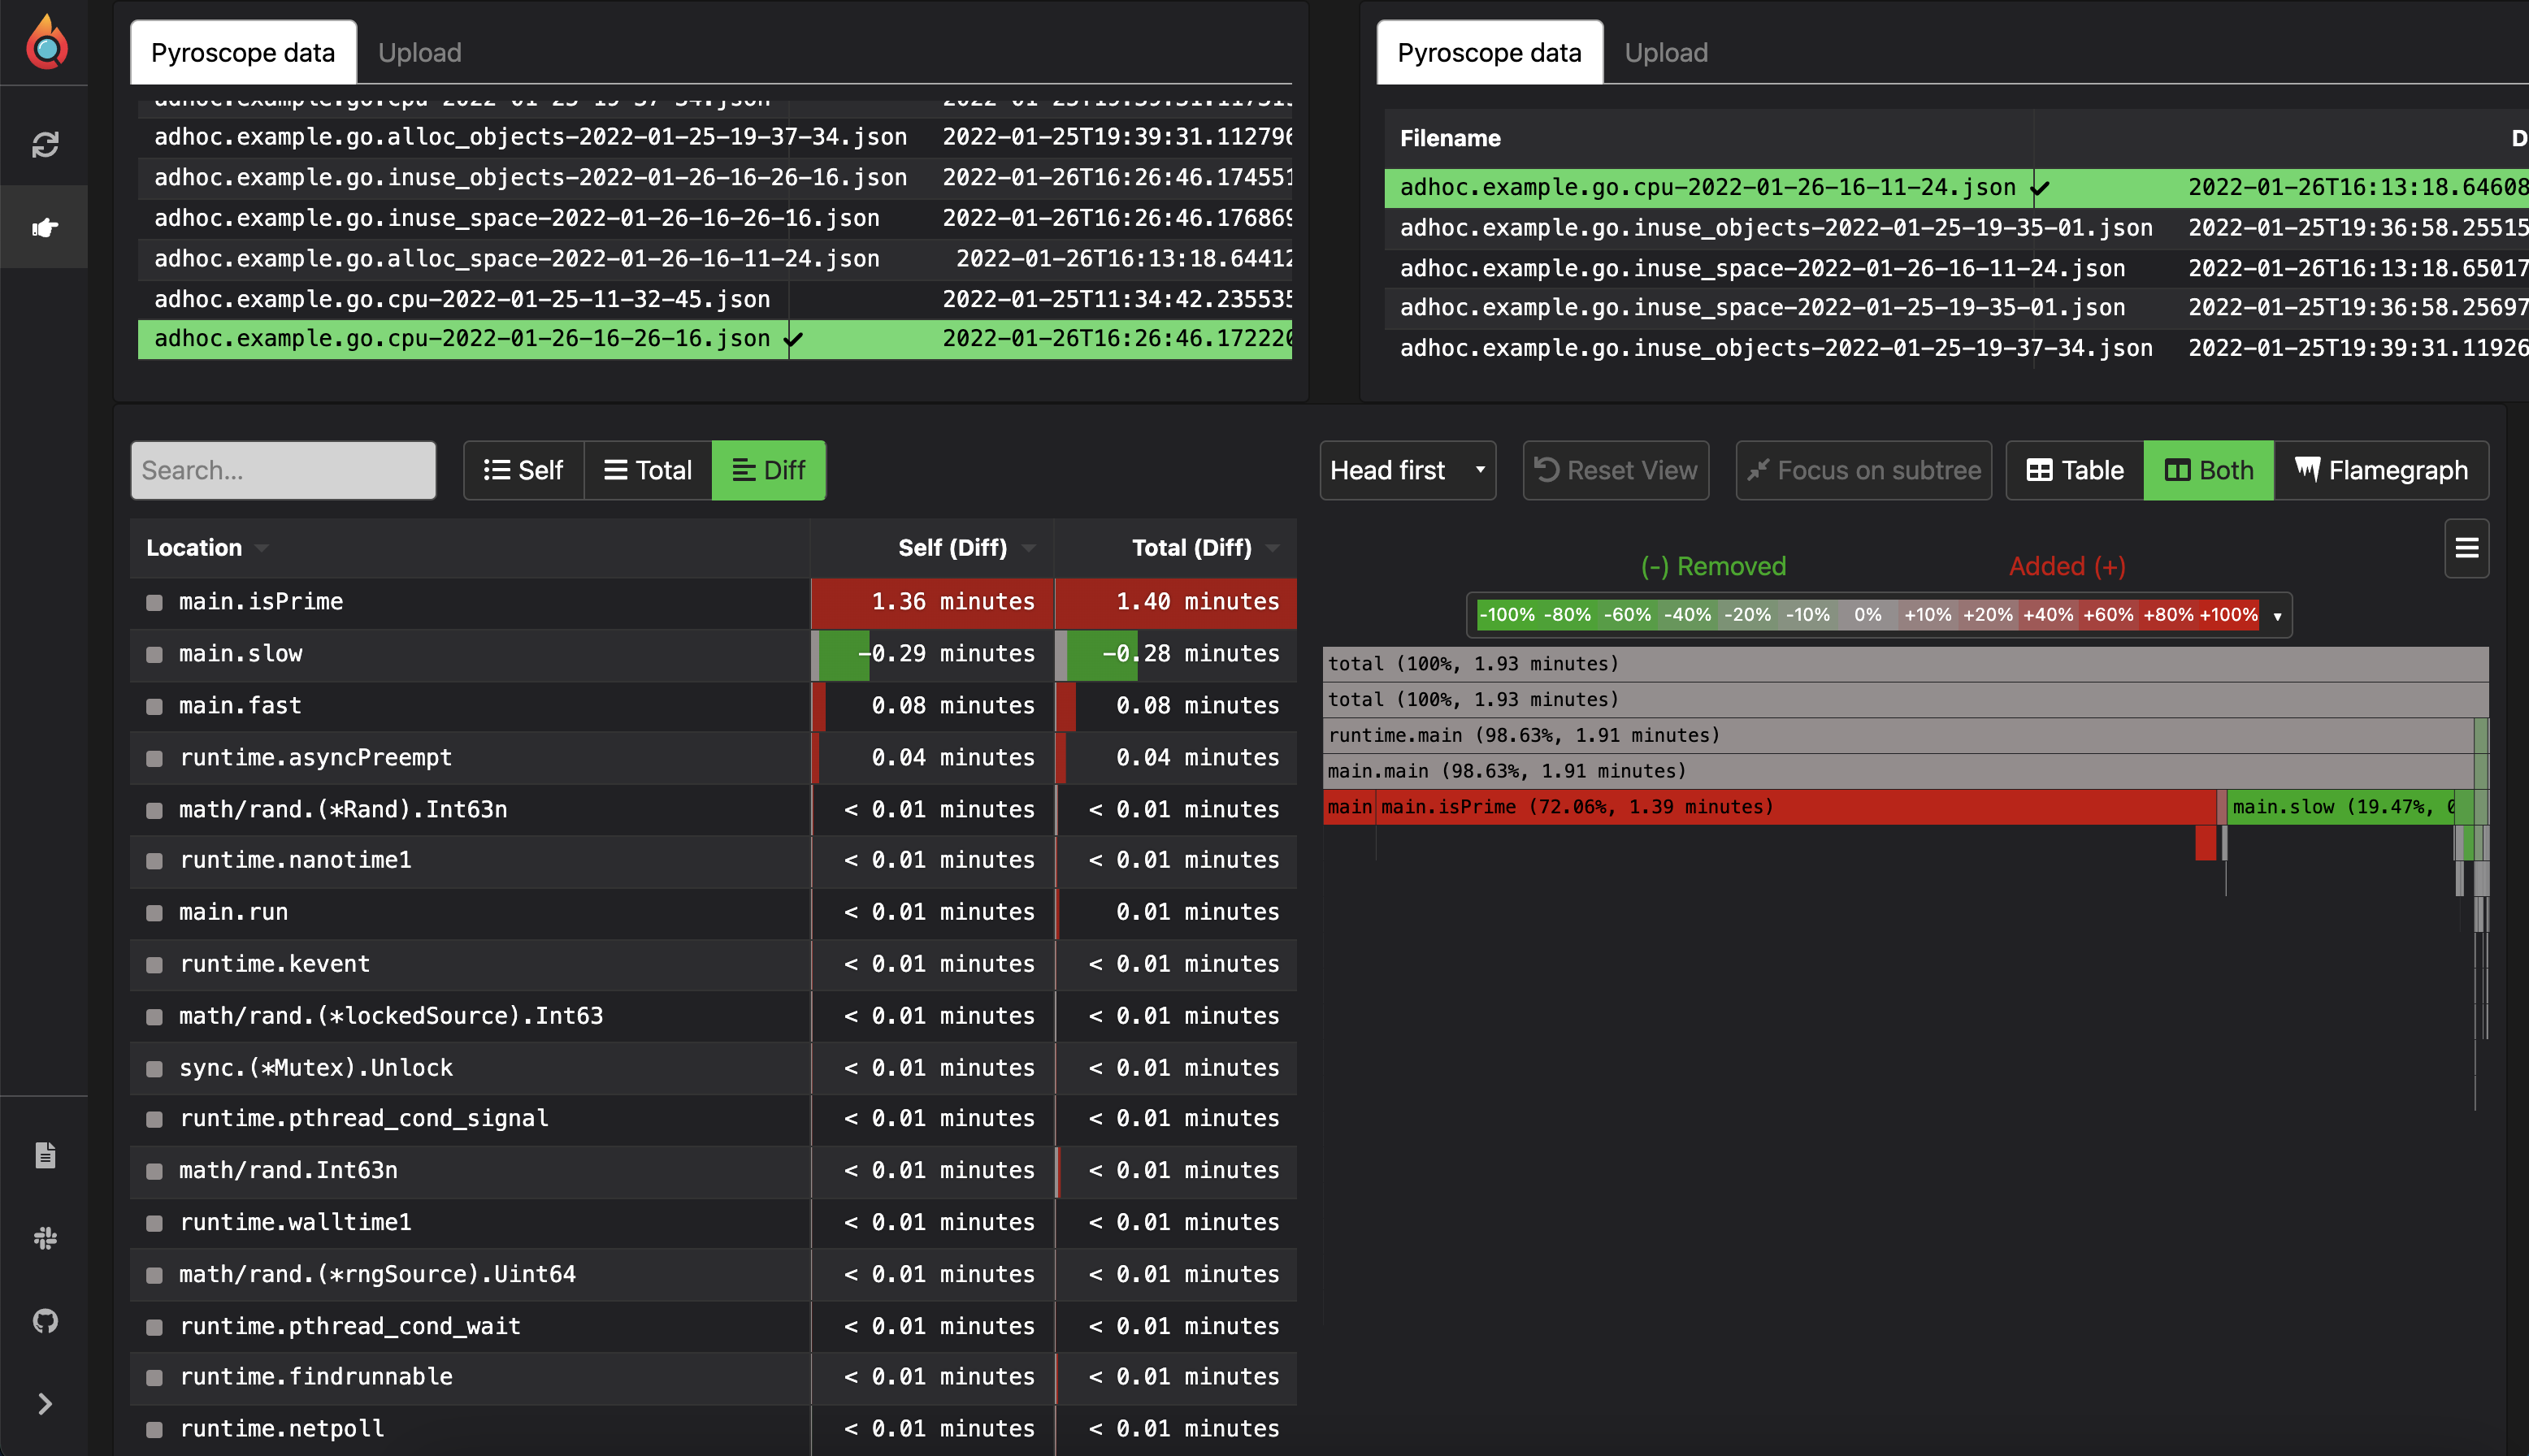
Viewing Flamgraph diffs between two adhoc profiles#
Similar to how we have the diff view for continuous profiling, Adhoc also supports calculating the diff between two flamegraphs.
This functionality requires server-side code, so it is only available for files saved in the ~/.pyroscope directory. We plan to improve this over time, or potentially even compile these functions to WASM.
Coming soon!#
As of January 26, 2022, adhoc mode is meant for three main use cases:
- Profiling scripts using Pyroscope: Running
pyroscope adhoccommand and being able to view/share the resulting flamegraphs - Viewing profiles exported from Pyroscope: Dragging and dropping files that have been exported to
jsonformat and then analyzing those flamegraphs - Getting a shareable standalone HTML flamegraph that has the same UI and analysis features as Pyroscope web interface
We plan to expand functionality and support more languages, formats and use cases:
- Supporting drag-and-drop for pprof files
- Adding ability to comment on stored files
- Adding descriptions / annotations to flamegraphs
- Getting a shareable link to flamegraphs
- UI improvements
- and much more!
Let us know if you have any recommendations for how to improve adhoc mode!
Follow us on Github or Twitter or join our slack for updates on this!