
![]()
Greetings Pyroscope Community!
We have some exciting news to share with you today. As you know, Pyroscope has always been committed to delivering top-notch continuous profiling solutions, empowering developers to optimize their code and infrastructure for enhanced performance. Today, we have a game-changing update to announce.
We are thrilled to inform you that Pyroscope Cloud will no longer be accepting new signups. Instead, we invite you to join us on a new and improved platform that will revolutionize the way you approach profiling: Pyroscope within Grafana Cloud!
Why the merge? By joining forces with Grafana, we are uniting the strengths of Pyroscope and Phlare to accelerate both the adoption and the value of continuous profiling.
With Grafana Cloud Profiles, the Pyroscope project has integrated into the Grafana ecosystem. The integration of Pyroscope and Phlare projects has resulted in a powerful and comprehensive profiling solution that goes beyond the capabilities of Pyroscope Cloud. By leveraging Grafana's expertise in data visualization and Grafana Cloud's managed observability stack, we are taking profiling to the next level expanding from 1 to 3 different vies for viewing profiling data:
Grafana Cloud Profiles app plugin view#
This is the view you're likely familiar with if you're a Pyroscope OSS or Pyroscope cloud user. This is now included in the Grafana UI as an app plugin. That being said, the ceiling for what is possible with this app plugin is significantly higher as part of Grafana ecosystem which is already connected to other data sources like logs, metrics, and traces. Stay tuned for more functionality of this app plugin that makes use of other datasources to enhance profiling data as well as overall insights.
Dashboard view#
This is a view that anyone who has used Grafana before is likely familiar with. However, now that you can add profiles natively to your dashboards you can get a much more comprehensive and real-time view of your profiling data alongside your other mission-critical dashboard items.
Explore view#
Finally, we have the explore view which is convenient for making targeted queries to not only your profiling data, but also your other observability signals which you can now view side-by-side with profiles
What to expect with Pyroscope in Grafana Cloud#
We're excited to take this next step in Pyroscope's journey, but want to do so in a way that is convient for our community. Here's what you can expect:
- Seamless Transition: Existing Pyroscope Cloud users can continue to use pyroscope.cloud service without disruption. You will have ample time to migrate your profiles to the new platform at your convenience
- Enhanced Scalability: Pyroscope is now horizontally scalable to accommodate workloads of any size, ensuring optimal performance for projects of all scales
- Broad Language Support: The Pyroscope SDKs have been updated and standardized, allowing you to collect profiles from major languages such as Go, Python, Ruby, Java, eBPF, .NET, PHP, Node.js, and Rust
- Robust Visualization Options: Grafana's data visualization expertise has enriched the frontend and UI of Pyroscope in Grafana Cloud, providing multiple ways to visualize and analyze profiling data. You'll have a comprehensive set of tools at your disposal, including the App plugin, Explore view, and Dashboard view.
To learn more about this exciting development, we encourage you to read the official announcement on the Grafana blog.
How to get started in Grafana Cloud Profiles#
Step 1: Log into your Grafana Cloud account. (If you don’t already have one, you can sign up for free. )
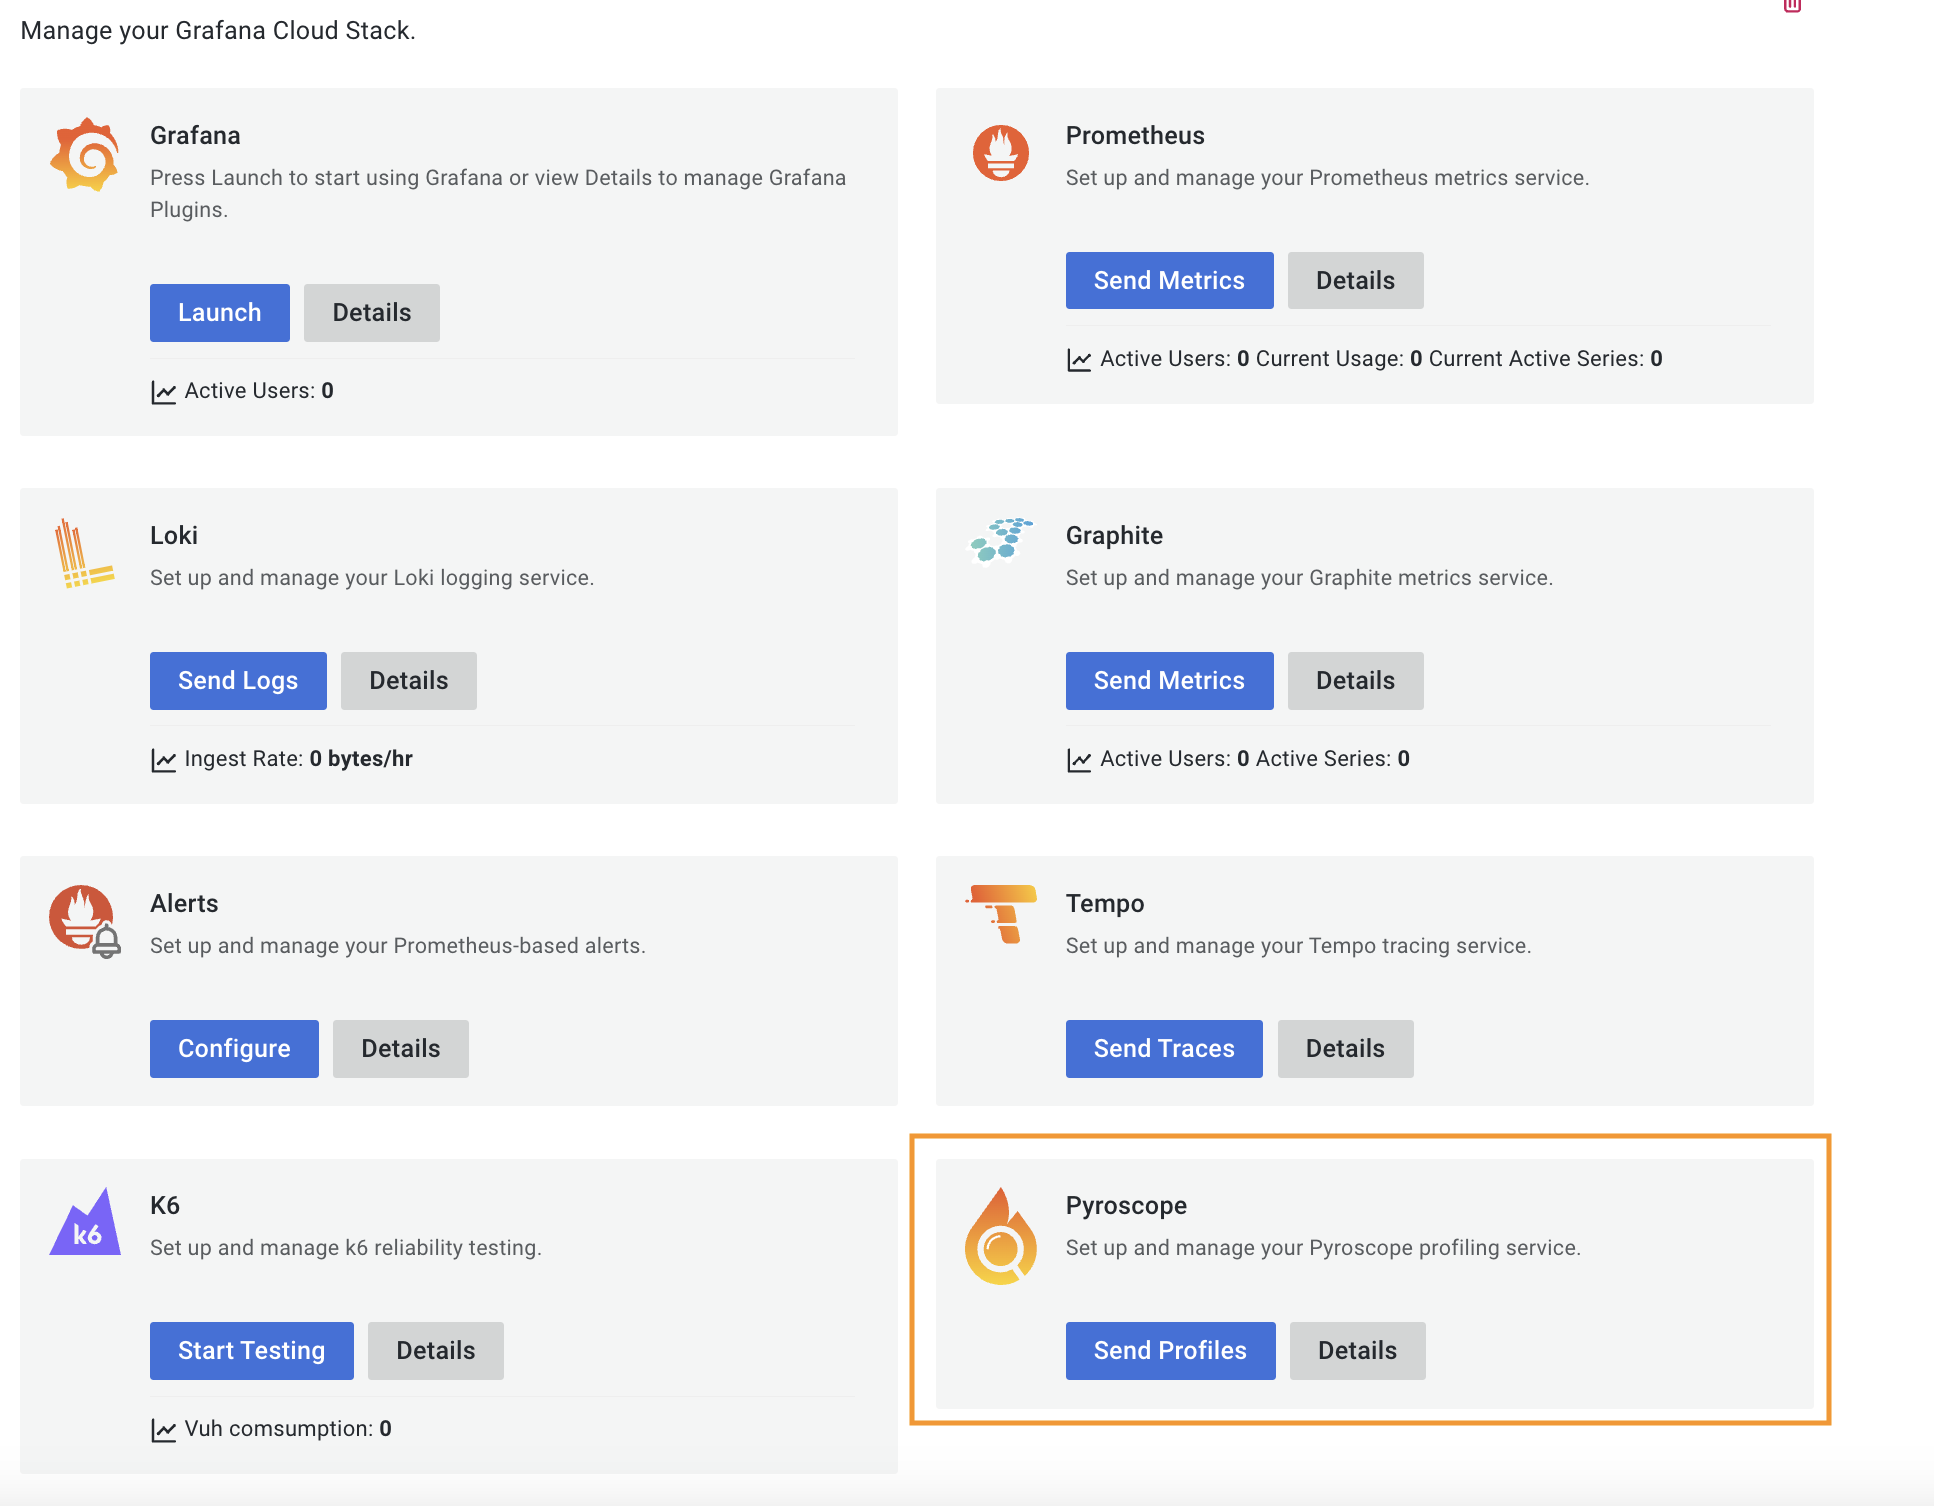
Step 2: Find Pyroscope in your stacks
Step 3: Follow the client instructions on how to send profiles from your application
Whats next for Grafana Cloud Profiles?#
By converging the efforts of Pyroscope and Grafana, we are excited to advance the fields of application profiling and observability. We've seen how by optimizing resource utilization and gaining a deeper understanding of your systems through profiling, you can deliver better software faster.
As always, your feedback and input are invaluable to us. Please share your success stories, feature requests, and any other insights you may have.
Stay tuned for more exciting updates and developments on Pyroscope within Grafana Cloud. We can't wait to embark on this profiling journey with you!
Happy profiling!