

We started Pyroscope a few years ago, because we had seen, first-hand, how profiling was a powerful tool for improving performance, but at the time profiling was also not very user-friendly. Since then, we've been working hard not only to make Pyroscope easier to use, but also to make it easier to get value out of it.
As it stands today, Pyroscope has evolved to support an increasingly wide array of our community's day-to-day workflows by adding a valuable extra dimension to their observability stack:
Application Developers

- Resolve spikes / increases in CPU usage
- Locate and fix memory leaks and memory errors
- Understand call trees of your applications
- Clean up unused / dead code
SREs

- Create performance-driven culture in dev cycle
- Spot performance regressions in codebase proactively
- Configure monitoring / alerts for infrastructure
- Optimize test suites and team productivity
Engineering Managers

- Get real-time analysis of resource utilization
- Make efficient cost allocations for resources
- Use insights for better decision making
Why we built a cloud service#
As our community has grown to include this diverse set of companies, users, and use-cases, we've had more people express interest in getting all the value from using Pyroscope, but without some of the costs that come with maintaining and scaling open source software. Some of the other reasons we decided to build a cloud service include:
- Companies who have less time/resources to dedicate to setting up Pyroscope
- Companies operating at scale who need an optimized solution that can handle the volume of data that is produced by profiling applications at scale
- Users who are less technical and want a solution that's easy to use and requires little to no configuration
- Users who want access to the latest features and bug fixes as soon as they are released (with zero downtime)
- Users who want additional access to the Pyroscope team's profiling expertise and support (past our community Slack and GitHub)
And from our side, we believe that a cloud product will:
- Making it easier for more companies to adopt Pyroscope
- Providing more feedback to help prioritize features on our road map
- Providing more resources to invest in Pyroscope's open source projects
- Making it easier to offer integrations with other tools in the observability stack (e.g. Grafana, Honeycomb, Gitlab, Github, etc.)
Plus, we got to solve a lot of really cool challenges along the way!
Introducing Pyroscope Cloud#
Today we are excited to announce the general availability of Pyroscope Cloud, our hosted version of Pyroscope!
Pyroscope Cloud enables you to achieve your observability goals by removing concerns around setup, configuration, and scaling. It's designed to be easy to use and gives you a significant amount of insight into your application's performance with very minimal configuration.
Some notable features for the cloud include:
- Horizontal scalability
- Support for high-cardinality profiling data
- Zero-downtime upgrades
- Data encryption at rest and in transit
- Compliance with SOC 2
- Extra support options beyond public Slack / Github
- Tracing integrations (Honeycomb and Jaeger)
Pyroscope Cloud's Major Scaling Improvements#
Similar to Pyroscope Open Source Software(OSS), the cloud service is designed to store, query, and analyze profiling data as efficiently as possible. However, certain limitations that fundamentally limit the scalability of Pyroscope OSS (for now) have been removed in Pyroscope Cloud.
When running Pyroscope OSS at scale, eventually people run into the limitations of the Open Source storage engine. It is built around badgerDB, which is an embeddable key-value database written in Go. The reliance on this component makes the OSS version of Pyroscope scale vertically but not horizontally.
In the cloud, we replace BadgerDB with a distributed key-value store which allows more freedom to scale Pyroscope horizontally. We leverage many of the techniques used by Honeycomb and many Grafana projects (i.e. Loki, Tempo) but with particular adjustments made for the unique requirements of profiling data (stay tuned for future blog post on this).
This means that with Pyroscope Cloud you don't need to worry about limiting the number of applications, profiles, and tag cardinality that you need in order to get the most out of Pyroscope!
Pyroscope Cloud's Major Features#
We've built Pyroscope Cloud with several different use cases in mind:
Continuous profiling for system-wide visibility#
This feature used for profiling your applications across various environments. Most agents have support for tags which will let you differentiate between different environments (e.g. staging vs production) and other metadata (e.g. pod, namespace, region, version, git commit, pr, etc.). Using single, comparison, or diff view in combination with these tags will let you easily understand and debug performance issues.

- Which tags are consuming the most cpu and memory resources?
- How did the performance of my application change between versions?
- What is our most/least frequently used code paths?
- Which libraries are consuming the most resources?
- Where are memory leaks originating?
- etc.
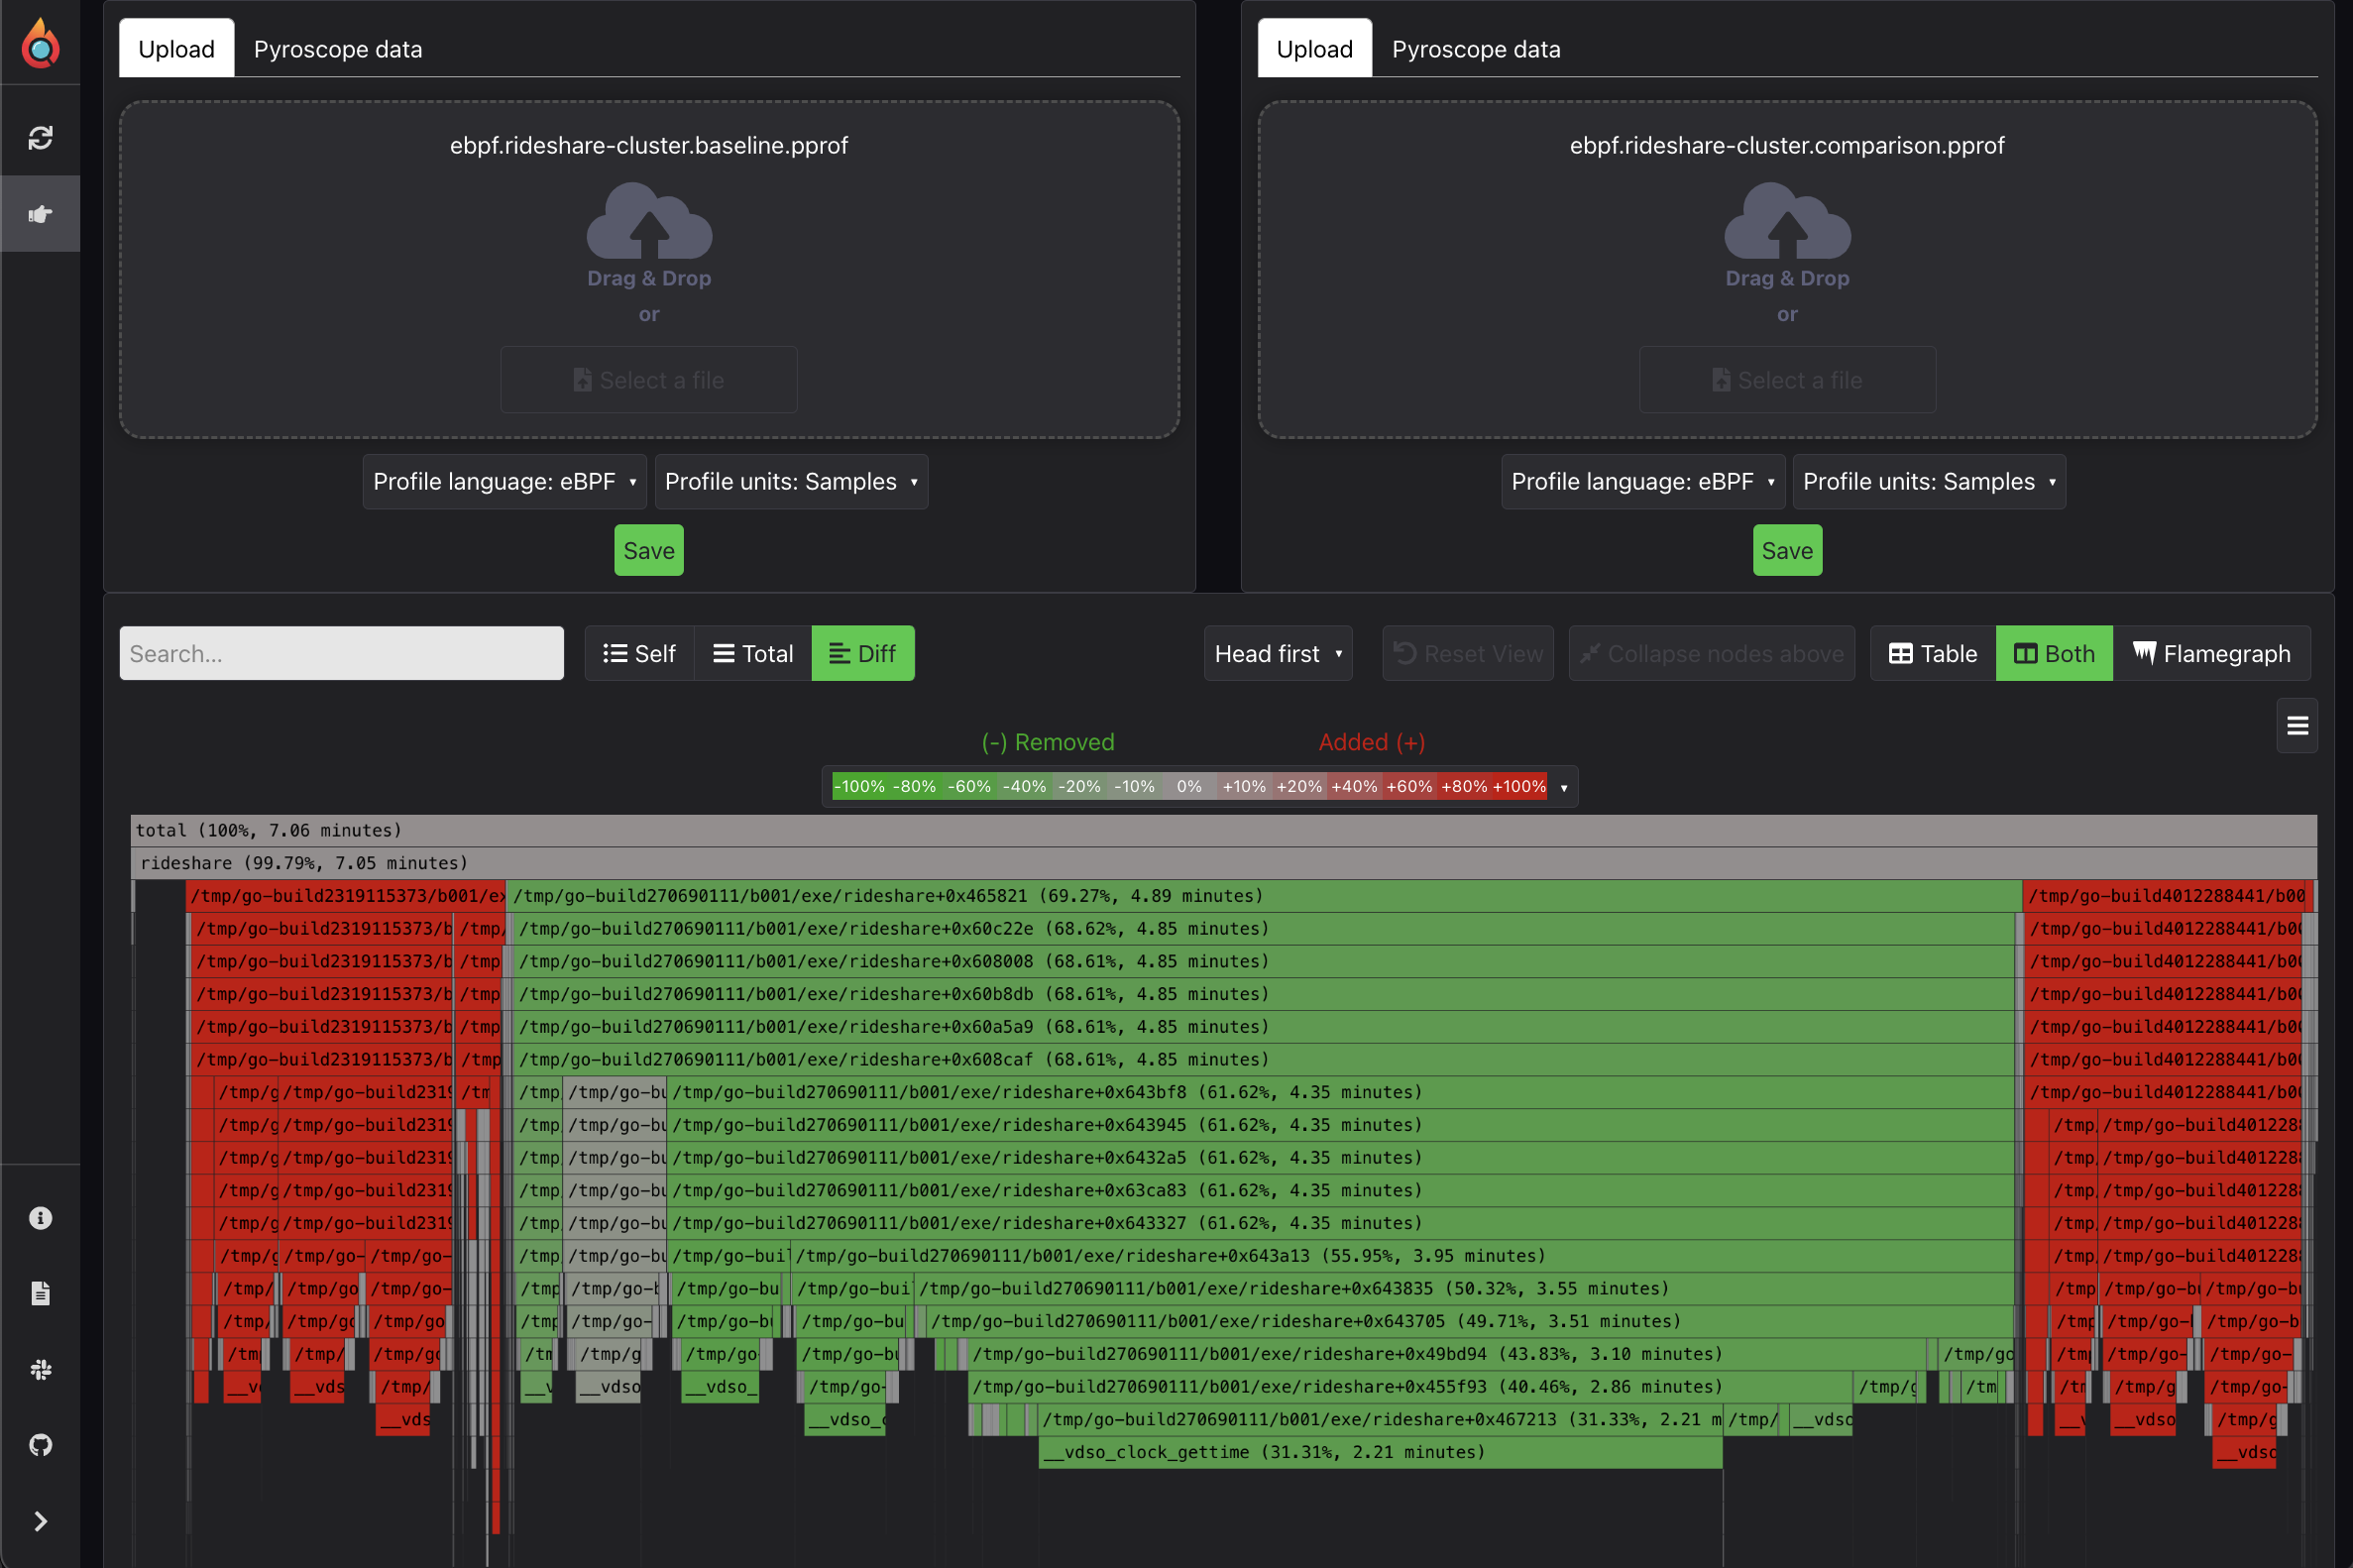
Adhoc profiling for deep-dive debugging#
This feature is used for when you may want to profile something in a more adhoc manner. Most commonly people use this feature to either upload previously recorded profiles or save a profile for a particular script. Where many used to save profiles to a random folder on their computer, they can use our adhoc page to store them more efficiently, share them with others, and view them with the same powerful UI that they use for continuous profiling.
Tracing exemplars for transaction-level visibility#
This feature is used for when you want to correlate profiling data with tracing data. While traces often will tell you where your application is running slow, profiling gives more granular detail into why and what particular lines of code are responsible for the performance issues. This view gives you a heatmap of span durations. We also have integrations with a few popular tracing tools:

Profile upload API for automated workflows and migrations#
Over time we've found that some of the major companies in various sectors have built their own internal profiling systems which often will ultimately dump a large collection of profiles into some storage system like S3.
Pyroscope Cloud's API is built to accept many popular formats for profiling data and then store them in a way that is optimized for querying and analysis. This means that you can redirect your existing profiling data to Pyroscope Cloud and then use the same UI that you use for continuous profiling to analyze it.
- Pprof Ingestion
- JFR Ingestion
- Collapsed Ingestion
# First get API_TOKEN from https://pyroscope.cloud/settings/api-keys
# Ingest profiles in pprof formatcurl \ -H "Authorization: Bearer $API_TOKEN" \ --data-binary @cpuprofile.pb.gz \ "https://pyroscope.cloud/ingest?format=pprof&from=1736539015&until=1736539025&name=my-app-name-pprof"How to get started with Pyroscope Cloud#
Migrating from Pyroscope OSS#
In order to migrate from Pyroscope OSS to Pyroscope Cloud, you can use our remote write feature to send your data to Pyroscope Cloud. This will allow you to continue using Pyroscope OSS while you migrate your data to Pyroscope Cloud.

You can also get started directly with Pyroscope Cloud, by signing up for a free account at pyroscope.cloud.
What's Next for Pyroscope Cloud#
- CI/CD Integrations (GitHub, GitLab, CircleCI, etc.): We've heard many using Pyroscope to profiling their testing suite and we have plans (link) for a UI specifically geared towards analyzing this data
- More integrations (Tempo, PagerDuty, etc.)
- More features (Alerting, etc.)
- More documentation (Tutorials, etc.)