Coming from a background working as a frontend developer at Grafana I'm no stranger to open source performance monitoring. I was part of a team that was responsible for the overall user experience of Grafana and performance was one of the key considerations. Along the line, I learned about a debugging technique known as profiling for monitoring application performance and fell in love ever since.
What is continuous profiling#
“Profiling” is a dynamic method of analyzing the complexity of a program, such as CPU utilization or the frequency and duration of function calls. With profiling, you can locate exactly which parts of your application are consuming the most resources. “Continuous profiling” is a more powerful version of profiling that adds the dimension of time. By understanding your system's resources over time, you can then locate, debug, and fix issues related to performance.
As a frontend developer, my experience with profiling was limited to the browser. However, in the course of my study, I discovered a new pattern of profiling that seems exciting– continuous profiling. Similar to how you use the profiler in the dev console to understand frontend performance issues, continuous profiling allows you to profile servers from various languages 24/7 and be able to understand resource usage at any particular time.
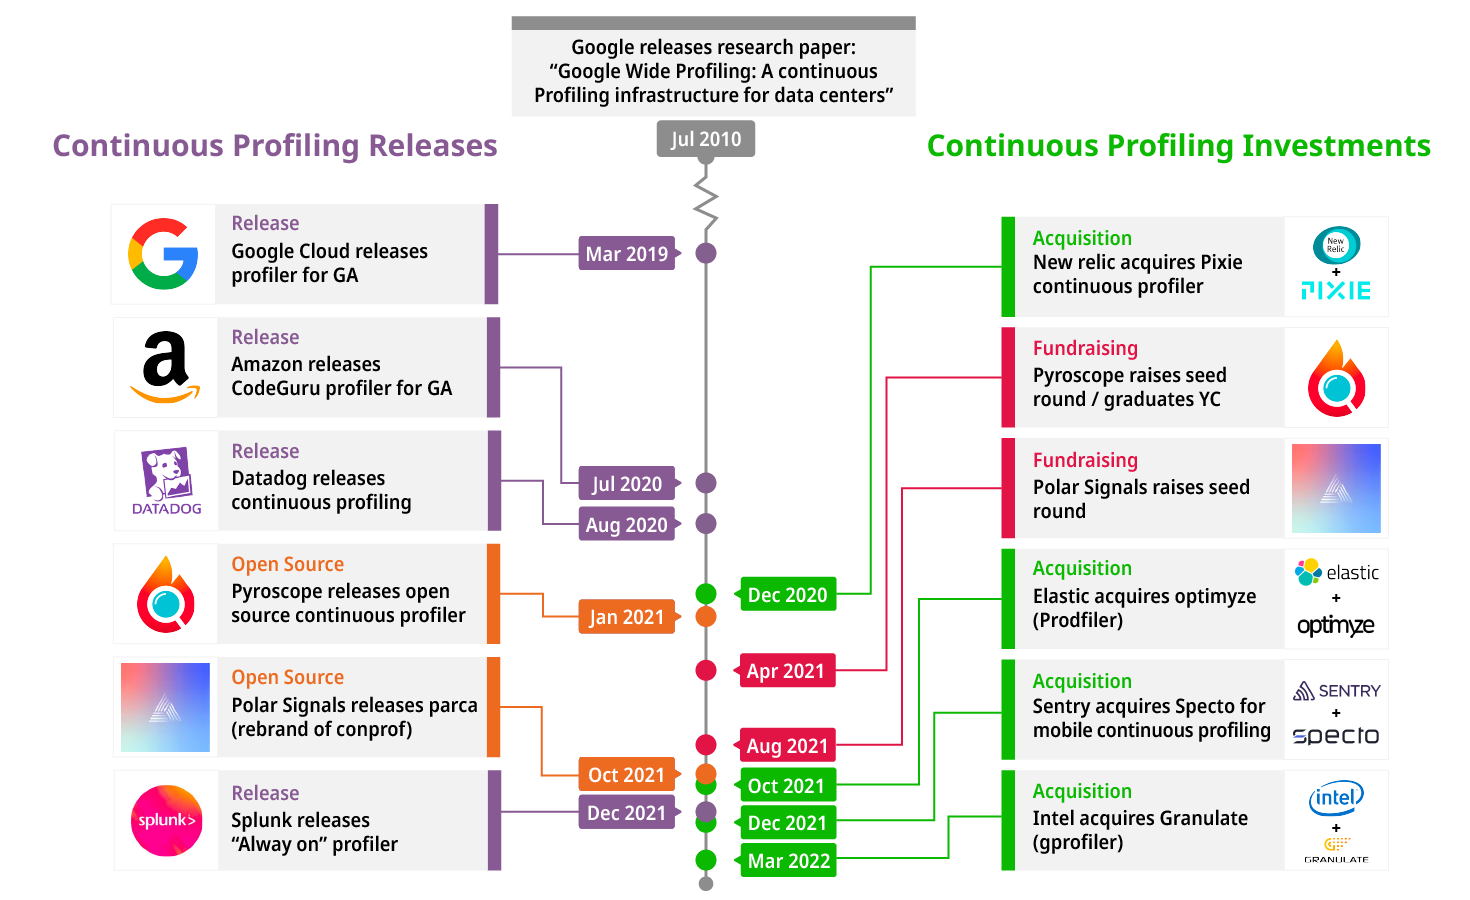
While continuous profiling is new to many, the concept is actually relatively old. In 2010, Google released a paper titled “Google Wide profiling: A continuous profiling infrastructure for data centers” where they make the case for the value of adding continuous profiling to your applications.
Industry traction for continuous profiling#
Since then, many major performance monitoring solutions have joined them in releasing continuous profiling products. As time has gone on, the continuous profiling space has been getting increasingly popular as various companies/VCs are more frequently making major investments in Continuous Profiling to keep up with demand for this type of monitoring.