Introduction#
In this article, I will introduce you to flamegraphs, how to use them, how to read them, what makes them unique, and their use cases.
What is a flamegraph#
A flamegraph is a complete visualization of hierarchical data (e.g stack traces, file system contents, etc) with a metric, typically resource usage, attached to the data. Flamegraphs were originally invented by Brendan Gregg. He was inspired by the inability to view, read, and understand stack traces using the regular profilers to debug performance issues. The flamegraph was created to fix this exact problem.
Flamegraphs allow you to view a call stack in a much more visual way. They give you insight into your code performance and allow you to debug efficiently by drilling down to the origin of a bug, thereby increasing the performance of your application.
note
Technically, a flamegraph has it's root at the bottom and child nodes are shown above their parents while an icicle graph has it's root at the top and child nodes are shown below their parents. However, for the purposes of this article, we will be using the flamegraph terminology.
How are flamegraphs generated?#
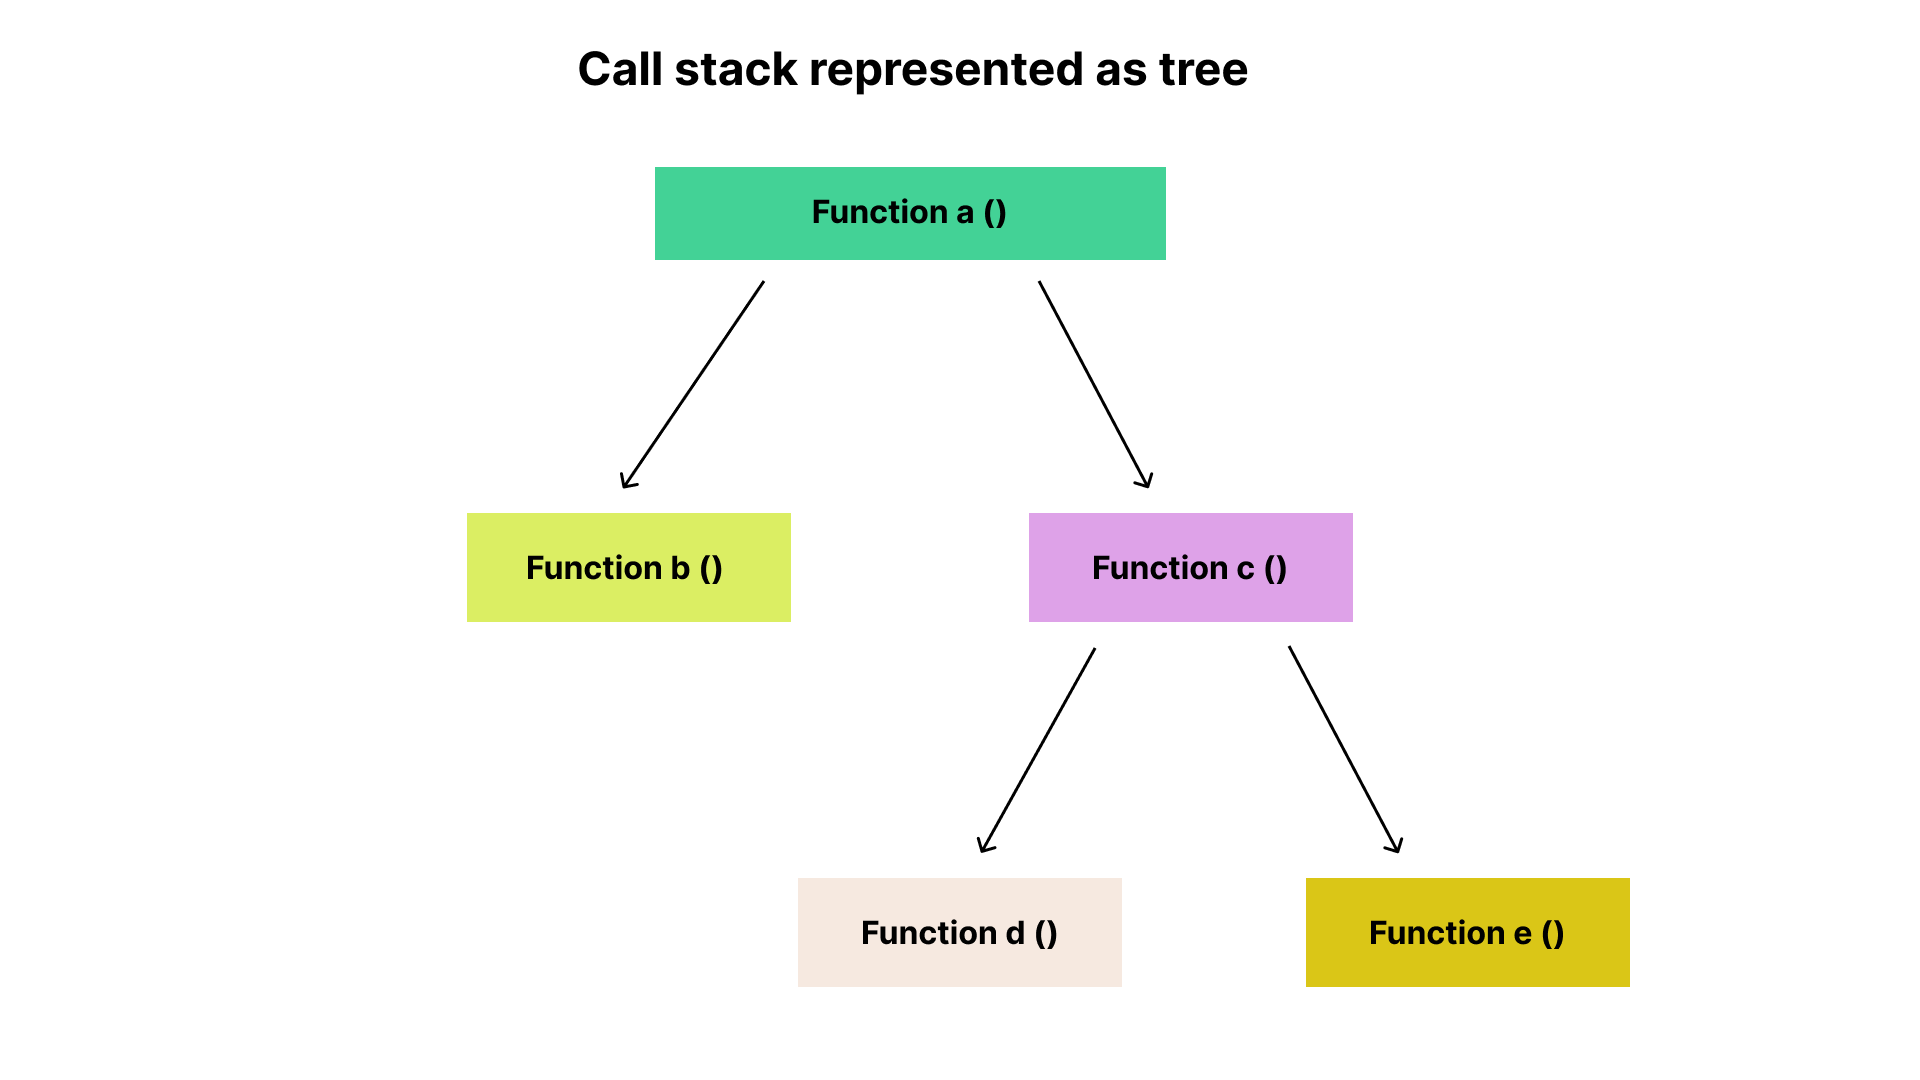
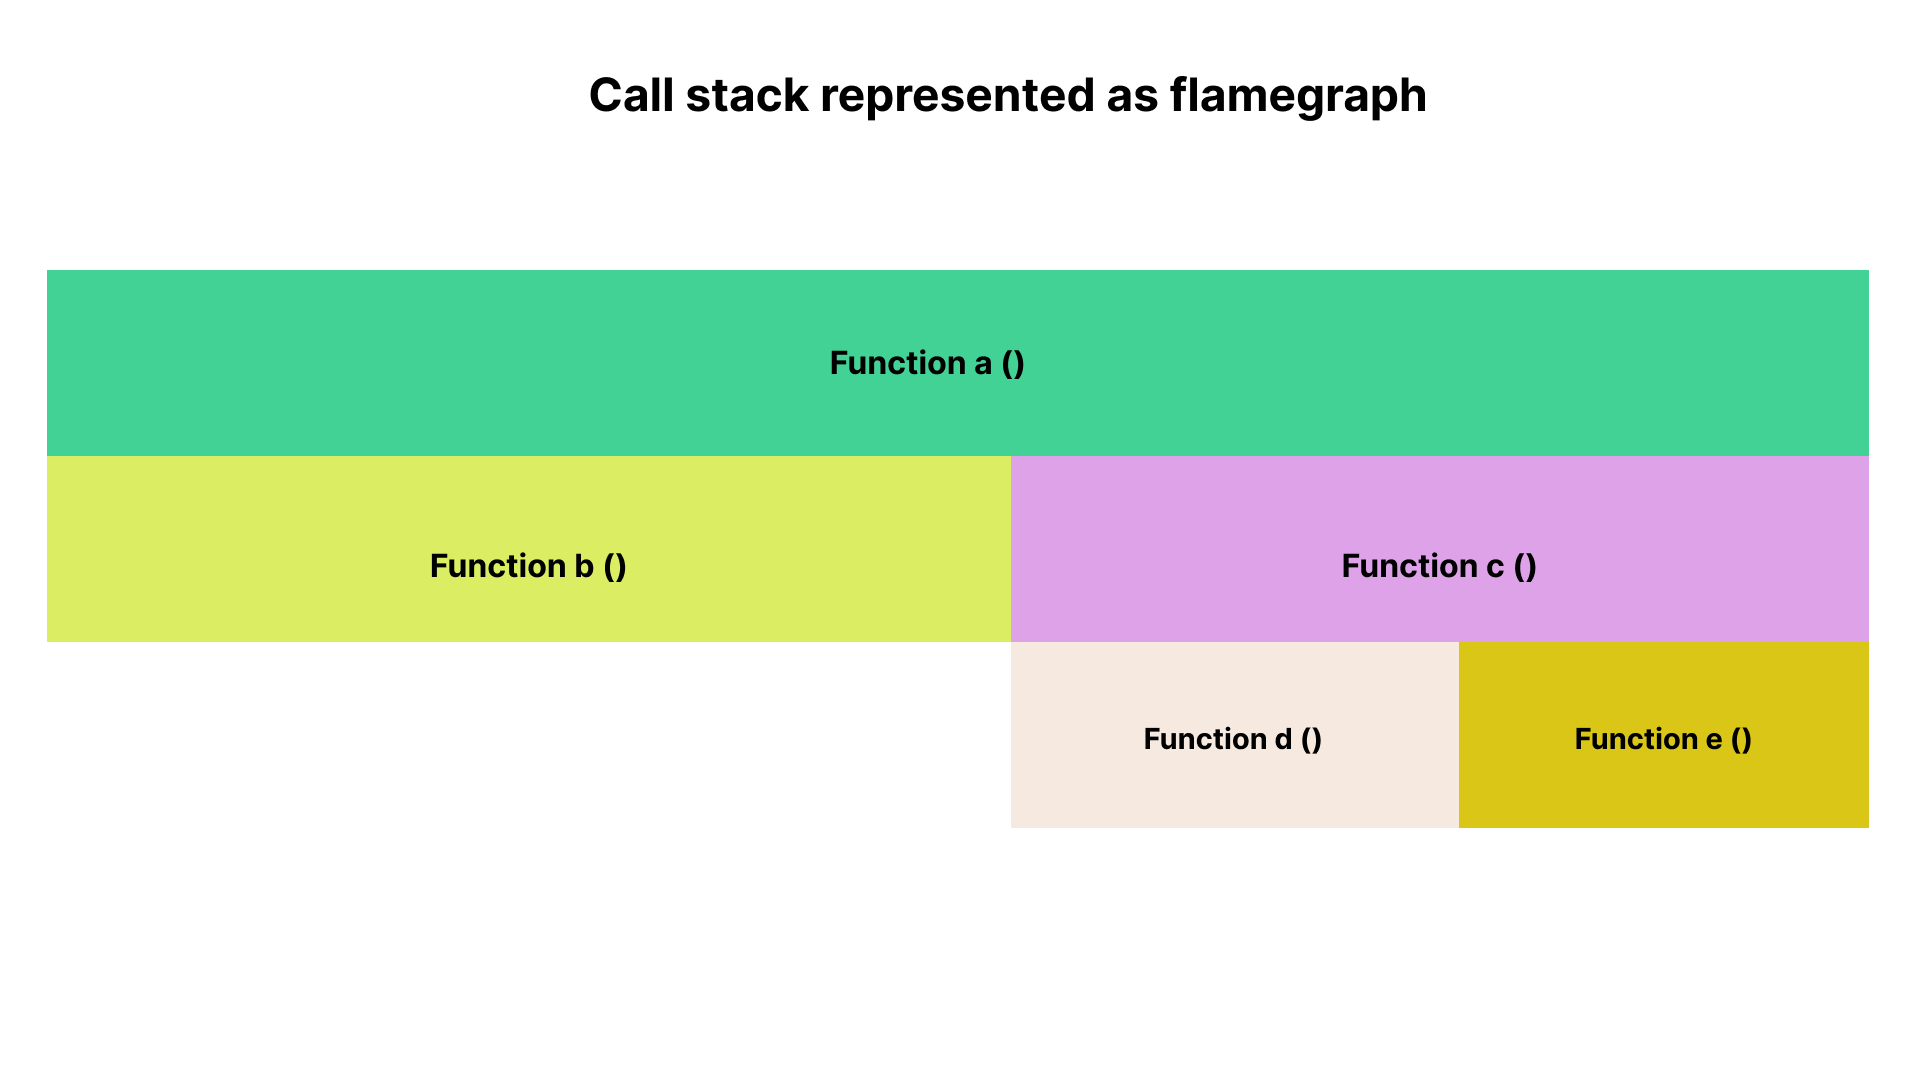
Flamegraphs are generated as a by-product of software profilers. They are represented in a tree-like structure where a node connects to another node to show their parent-child relationship. This corresponds to a call stack where one function calls another until it gets to the last function in the stack. The tree structure is then converted into a collection of boxes stacked together according to their relationship. This is known as a flamegraph.
Example use cases for flamegraphs#
Flamegraphs are often seen as more of a high level or abstract concept, so here are some situations where flamegraphs would be useful.
Using flamegraphs during pager duty response#
Imagine a scenario where you’re the only engineer in your team that is on-call for the week. Days passed and thankfully, you don’t get any outage alert. On the last day of your on-call, you get a pager duty alert showing a spike in latency in the US-east region. You start by checking the metrics and then logs. In the course of your investigation, you notice the problems go even deeper in the stack.
In a scenario like this, you begin to find ways to visualize CPU usage and identify what’s consuming your CPU resource the most. That is exactly where flamegraphs shine!
Using flamegraphs for debugging customer complaints#
Let’s assume you work in a team fully focused on improving the performance of your company’s product. While doing your normal morning routine, you notice an escalation from customer support. A customer just reported an unusual delay in load time. Looking at your graph, you notice a spike in latency in the US-east region. In the course of your investigation, you begin to notice the problem goes even deeper in the stack.
In a scenario like this, you begin to find ways to visualize CPU usage and identify what is consuming your CPU resource the most. That is also where flamegraphs come to your rescue!
Why flamegraphs are important?#
Flamegraphs are the best way to visualize performance data. They allow you to have a full view of your computing resources and how they are utilized, in one single pane.
In an industry where software changes fast, it is important to quickly understand profiles. Flamegraphs do a good job of visually representing the state of your application. In other words, when something goes wrong, you’re able to quickly identify the difference between an ideal “efficient” state and the buggy “inefficient” state.
Flamegraphs on Pyroscope#
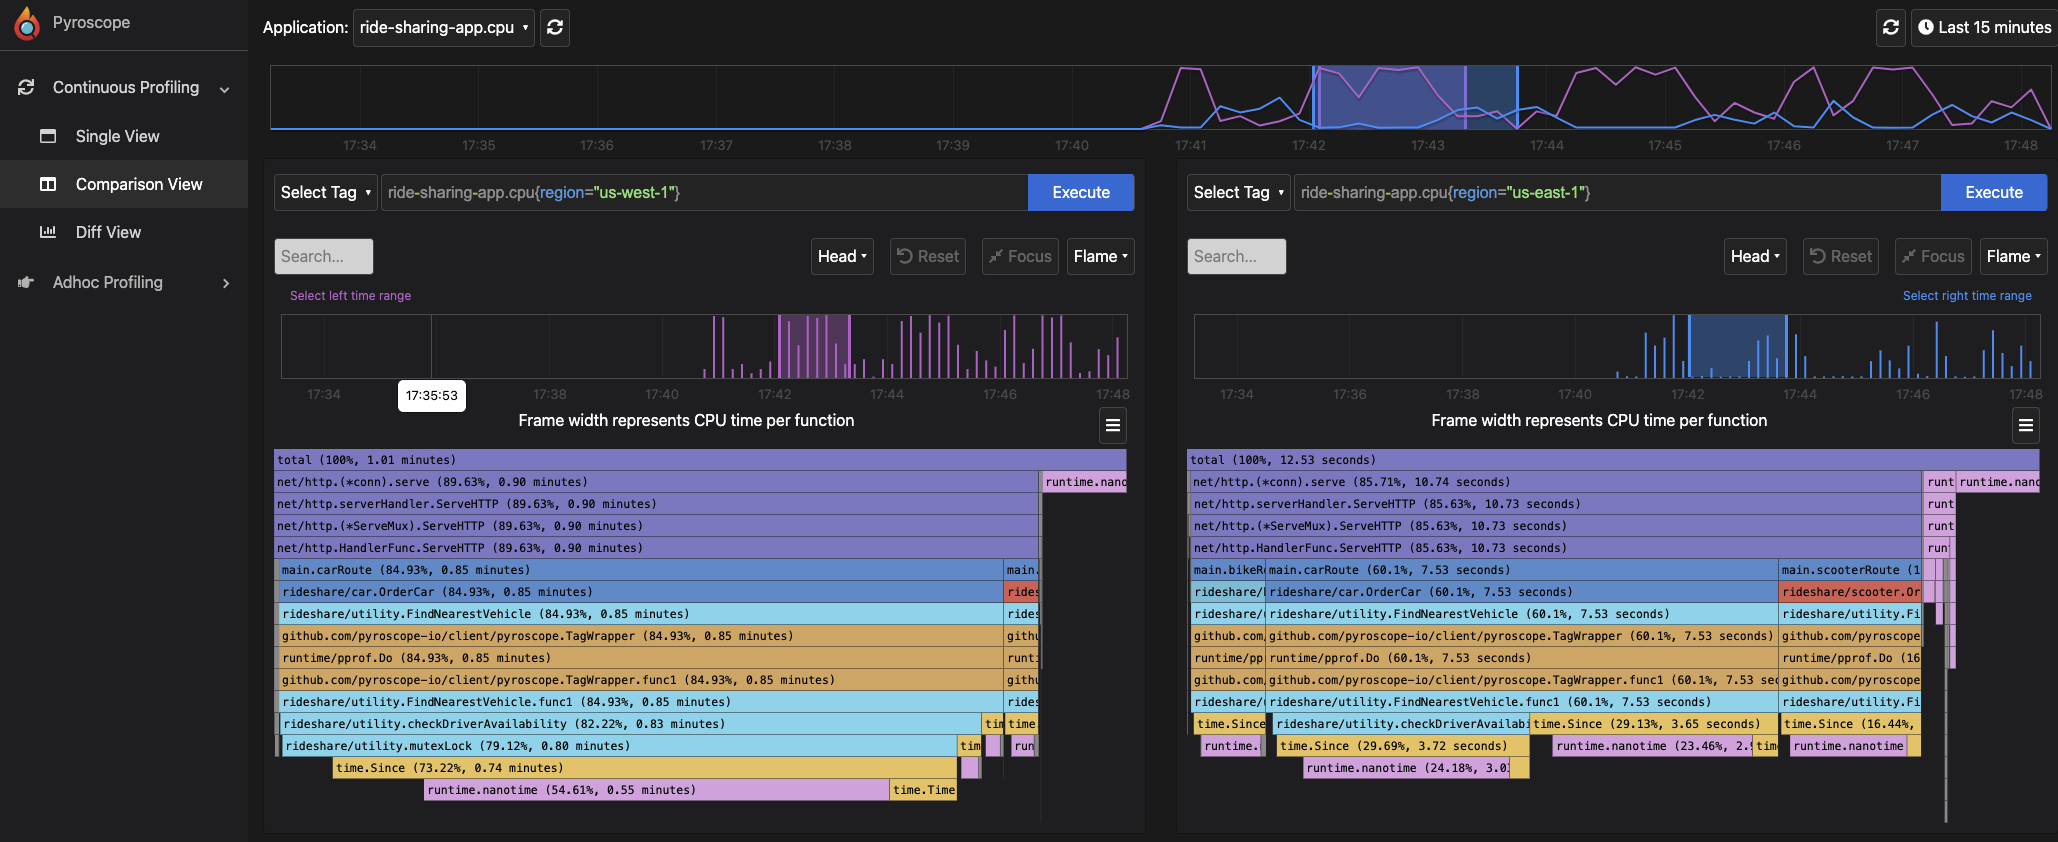
Pyroscope, an open-source continuous profiling platform, provides you with sleek flamegraphs to easily visualize your performance profile data. Pyroscope simplifies the entire process of collecting, converting, and analyzing profiles, thereby allowing you to easily focus on the things you care about the most. Pyroscope extends the functionalities of flamegraphs by allowing you to perform actions such as:
- flamegraph comparison
- sorting of stack frames from top to bottom and vice versa
- flamegraph export
- flamegraph collapsing, etc.
How to interact with a flamegraph using Pyroscope#
Pyroscope provides different ways of interacting with or using their flamegaph:
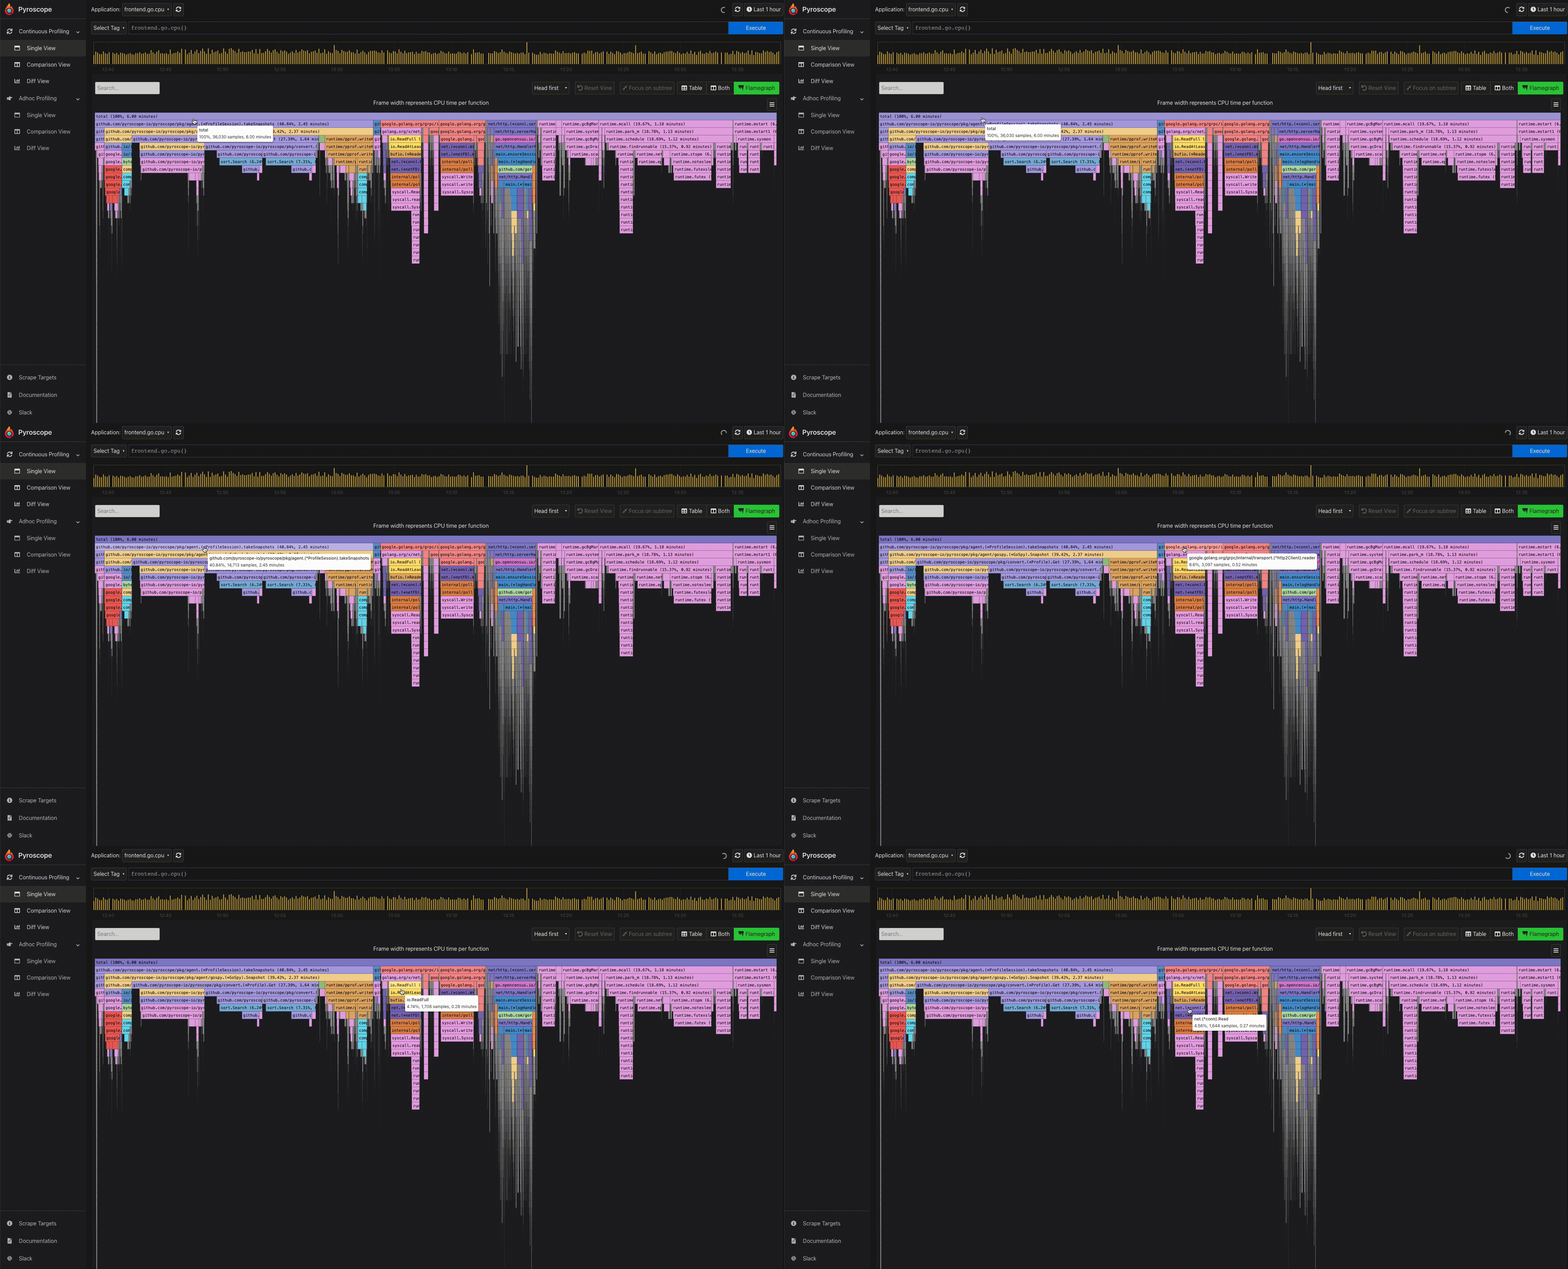
- Mouse hover for information: To easily view the information of a particular profile node, you can hover on the node using the mouse. This displays a tooltip showing the full function name, number of samples present in the profile node, and its corresponding percentage.
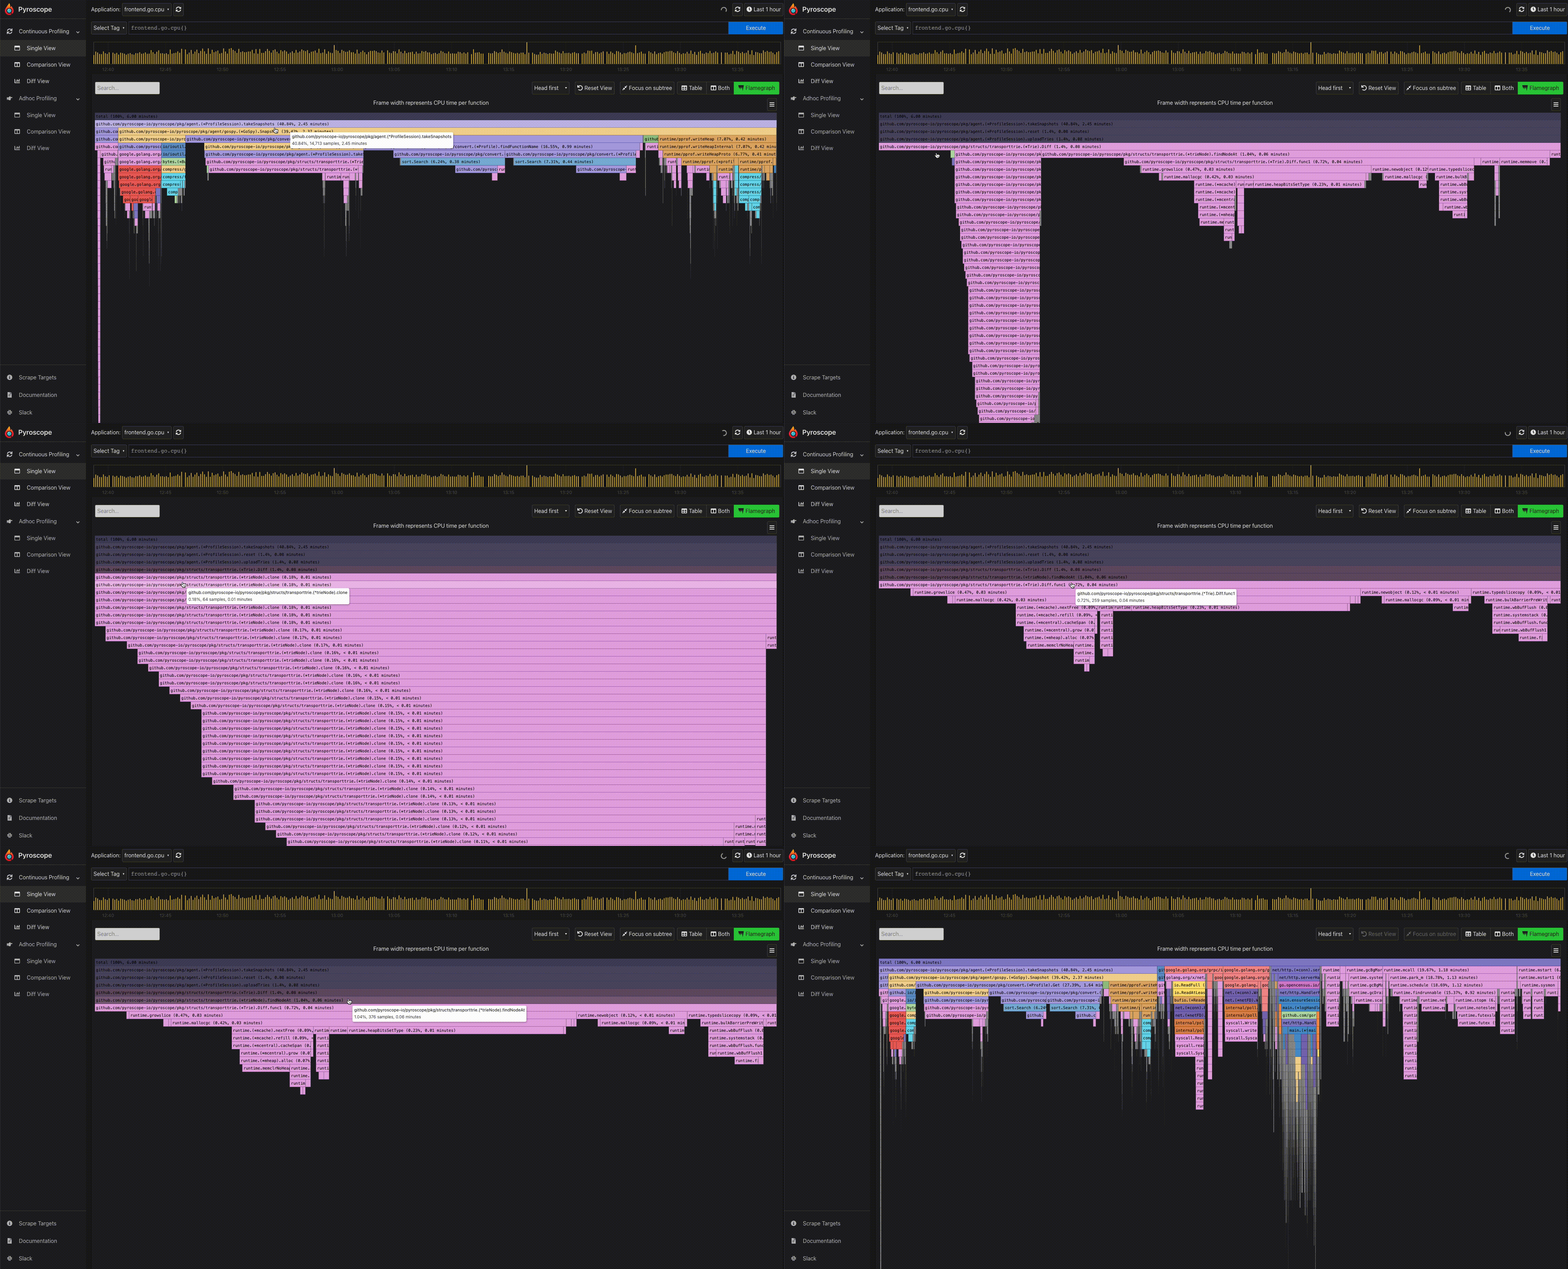
- Click to expand a node: Because of the tree-like structure of profiles, it can be tricky to display the relationship all at once. Flamegraphs makes it easy to navigate from a parent to a child node. By clicking a particular node, you can expand the node and view its subtree.
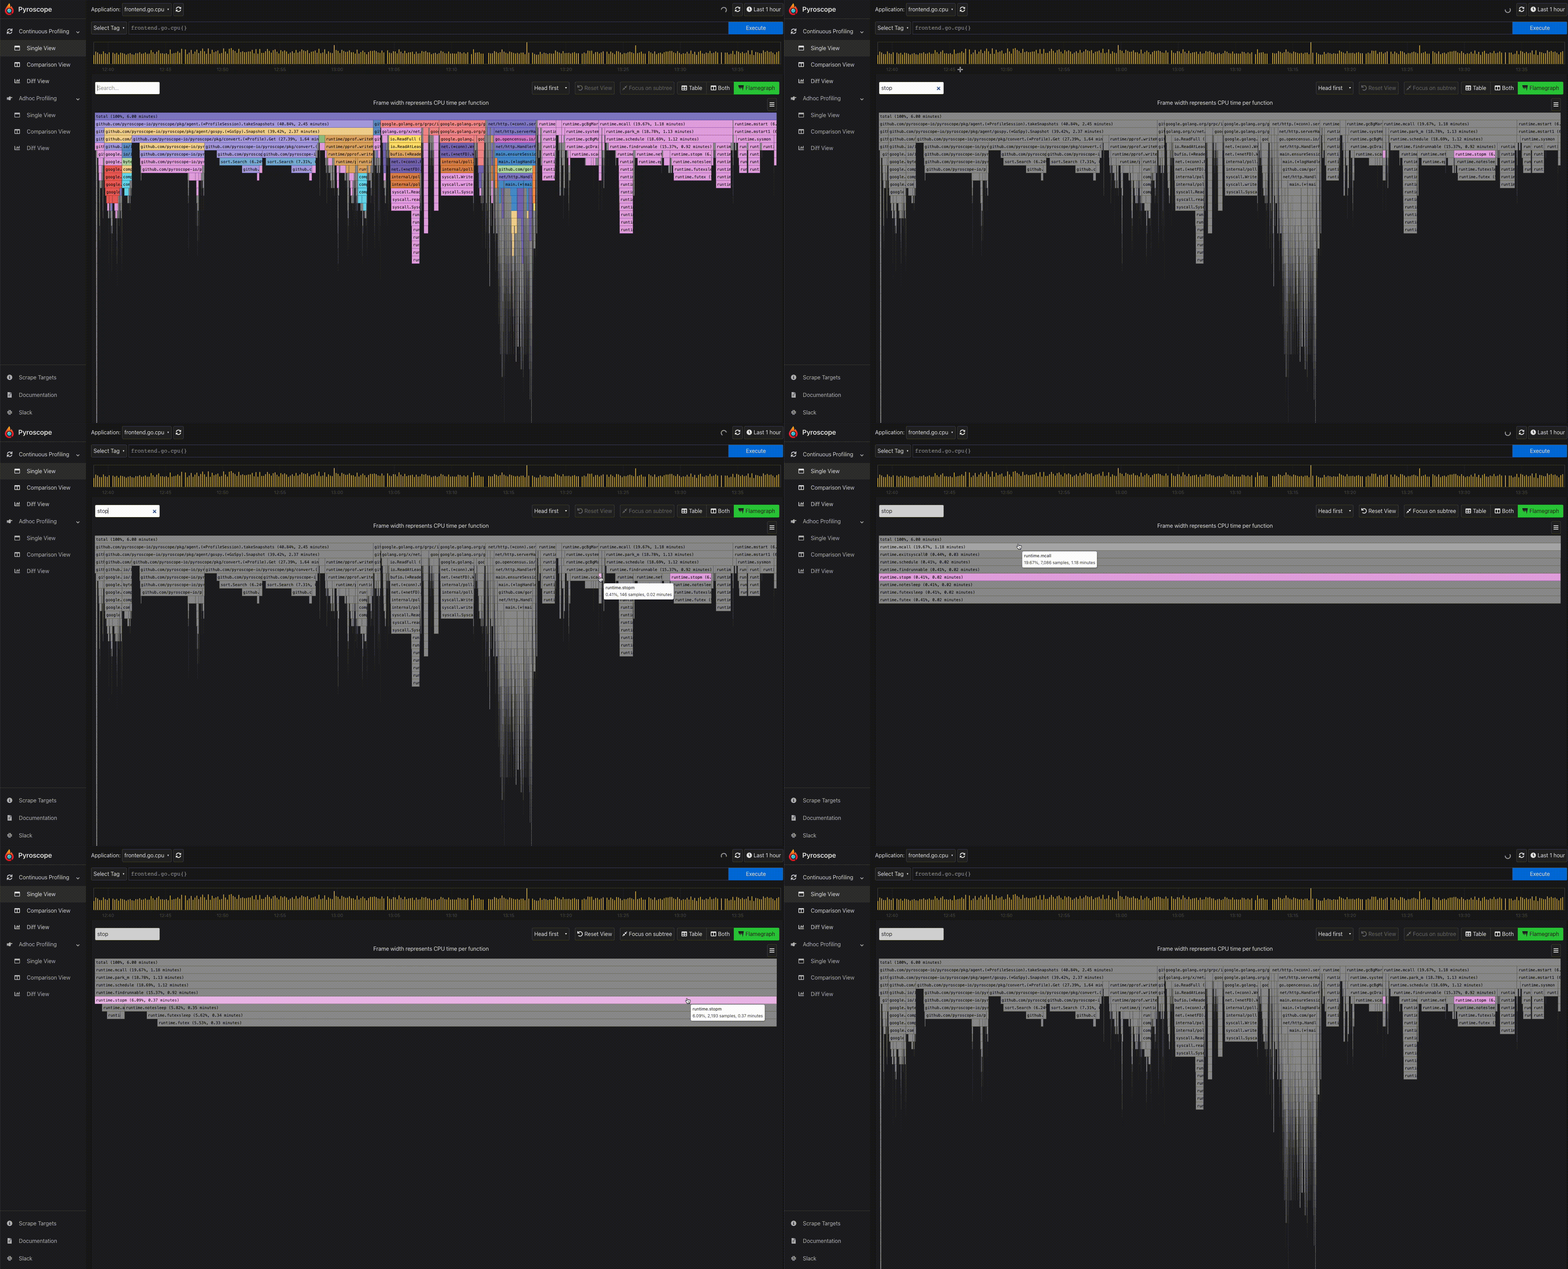
- Search: In the Pyroscope UI, there is a search box right above the flamegraph. This allows you to search for any term including function names.
How to interpret a flamegraph#
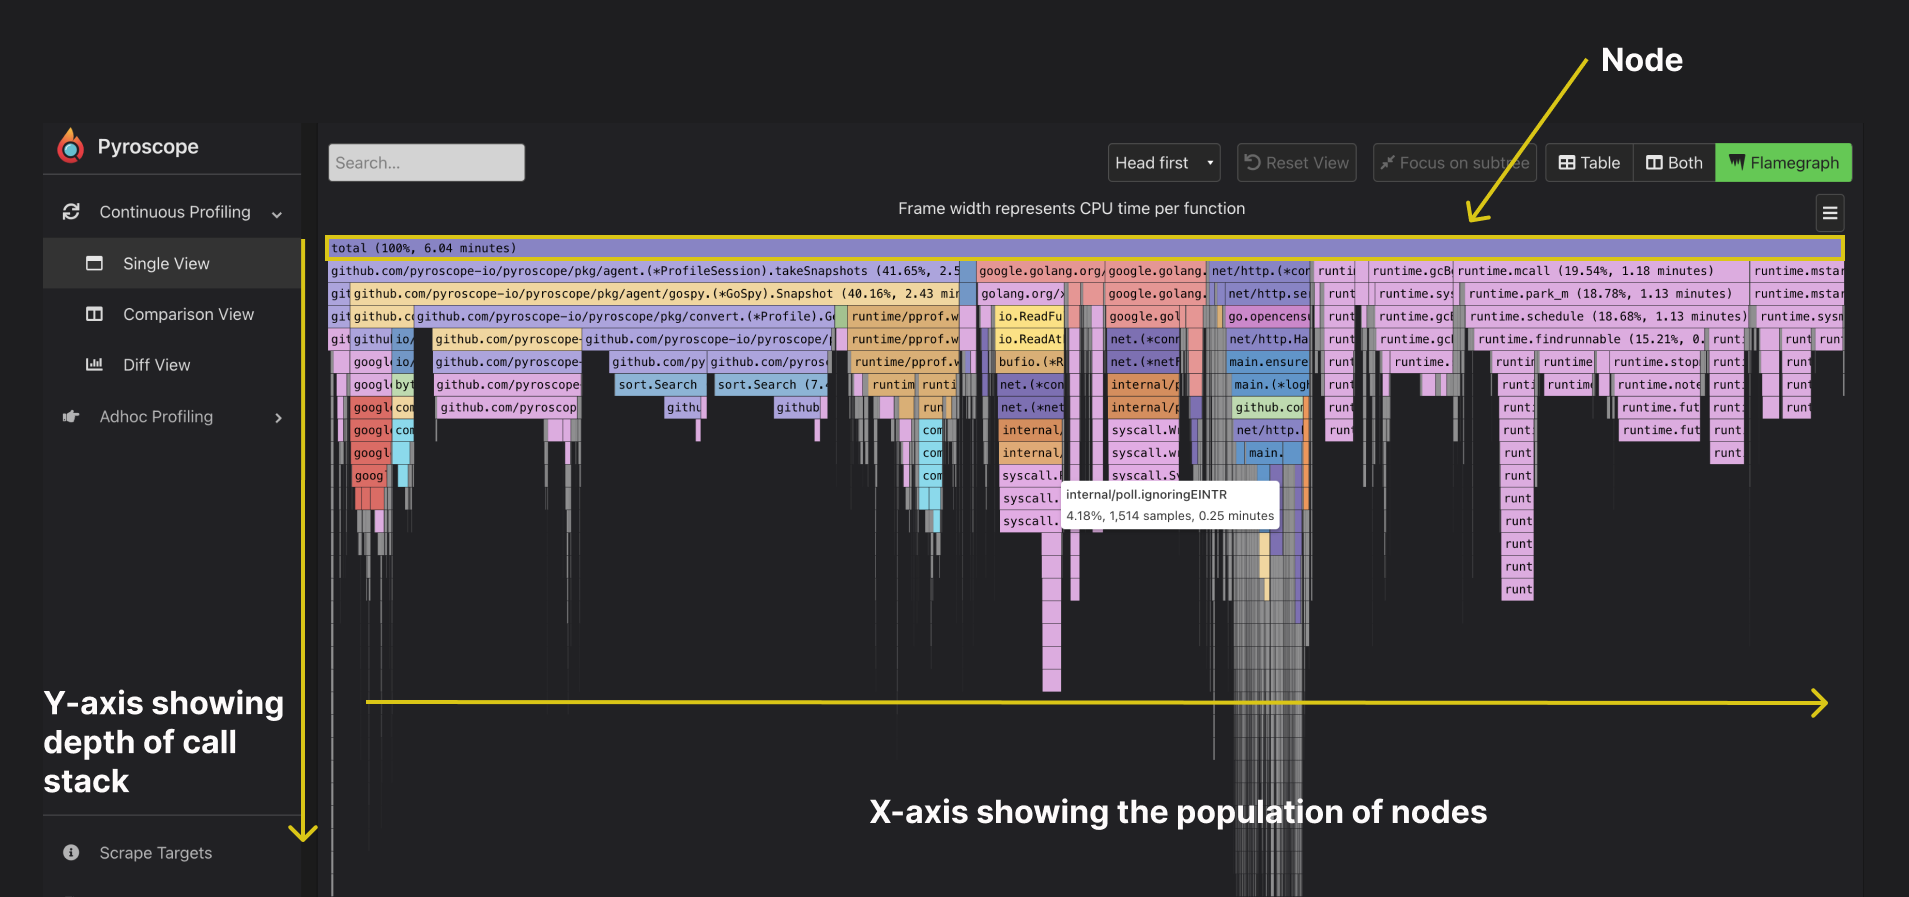
You can read a flamegraph by first understanding its features. They include:
- Node: They are represented as columns of rectangle boxes where each box represents a function
- Width: The width of each node shows how often it was present in the stack. In other words, the wider the box, the longer the runtime.
- X-axis: The x-axis shows the population of nodes. It does not show the passage of time but rather, it displays the entire collection of stack traces.
- Y-axis: The y-axis indicates the depth of the call stack. On Pyroscope, the head/root node is positioned at the top by default. The bottom box (tip of the flame) shows the function call that is on-CPU at the initial point of stack trace collection.
- Background color: The colors for profiles are generally not significant. They are distributed at random to distinguish between function calls. This helps the eye differentiate one profile from the other.
Interactive Playground#
With everything you've learned so far about flamegraphs, feel free to play around and interpret this interactive flamegraph embedded below.
Summary#
Now that you’ve learned about flamegraphs and how to use them, I encourage you to take a bold step in making performance profiling a priority in your observability journey. Metrics, logs, and traces, tells you a little bit of your observability story but flamegraphs make the story complete. Try Pyroscope today so that next time you encounter a performance issue, you have flamegraphs to your rescue.