Pyroscope Rideshare Example#
Note: For documentation on the Pyroscope pip package see our python docs
Background#
In this example we show a simplified, basic use case of Pyroscope. We simulate a "ride share" company which has three endpoints found in server.py:
/bike: calls theorder_bike(search_radius)function to order a bike/car: calls theorder_car(search_radius)function to order a car/scooter: calls theorder_scooter(search_radius)function to order a scooter
We also simulate running 3 distinct servers in 3 different regions (via docker-compose.yml)
- us-east-1
- us-west-1
- eu-west-1
One of the most useful capabilities of Pyroscope is the ability to tag your data in a way that is meaningful to you. In this case, we have two natural divisions, and so we "tag" our data to represent those:
region: statically tags the region of the server running the codevehicle: dynamically tags the endpoint (similar to how one might tag a controller rails)
Tagging static region#
Tagging something static, like the region, can be done in the initialization code in the config.tags variable:
import pyroscopepyroscope.configure( app_name = "ride-sharing-app", server_address = "http://pyroscope:4040", tags = { "region": f'{os.getenv("REGION")}', # Tags the region based off the environment variable })Tagging dynamically within functions#
Tagging something more dynamically, like we do for the vehicle tag can be done inside our utility find_nearest_vehicle() function using a with pyroscope.tag_wrapper() block
def find_nearest_vehicle(n, vehicle): with pyroscope.tag_wrapper({ "vehicle": vehicle}): i = 0 start_time = time.time() while time.time() - start_time < n: i += 1What this block does, is:
- Add the tag
{ "vehicle" => "car" } - execute the
find_nearest_vehicle()function - Before the block ends it will (behind the scenes) remove the
{ "vehicle" => "car" }from the application since that block is complete
Resulting flamegraph / performance results from the example#
Running the example#
To run the example run the following commands:
# Pull latest pyroscope image:docker pull pyroscope/pyroscope:latest
# Run the example project:docker-compose up --build
# Reset the database (if needed):# docker-compose downWhat this example will do is run all the code mentioned above and also send some mock-load to the 3 servers as well as their respective 3 endpoints. If you select our application: ride-sharing-app.cpu from the dropdown, you should see a flamegraph that looks like this (below). After we give 20-30 seconds for the flamegraph to update and then click the refresh button we see our 3 functions at the bottom of the flamegraph taking CPU resources proportional to the size of their respective search_radius parameters.
Where's the performance bottleneck?#
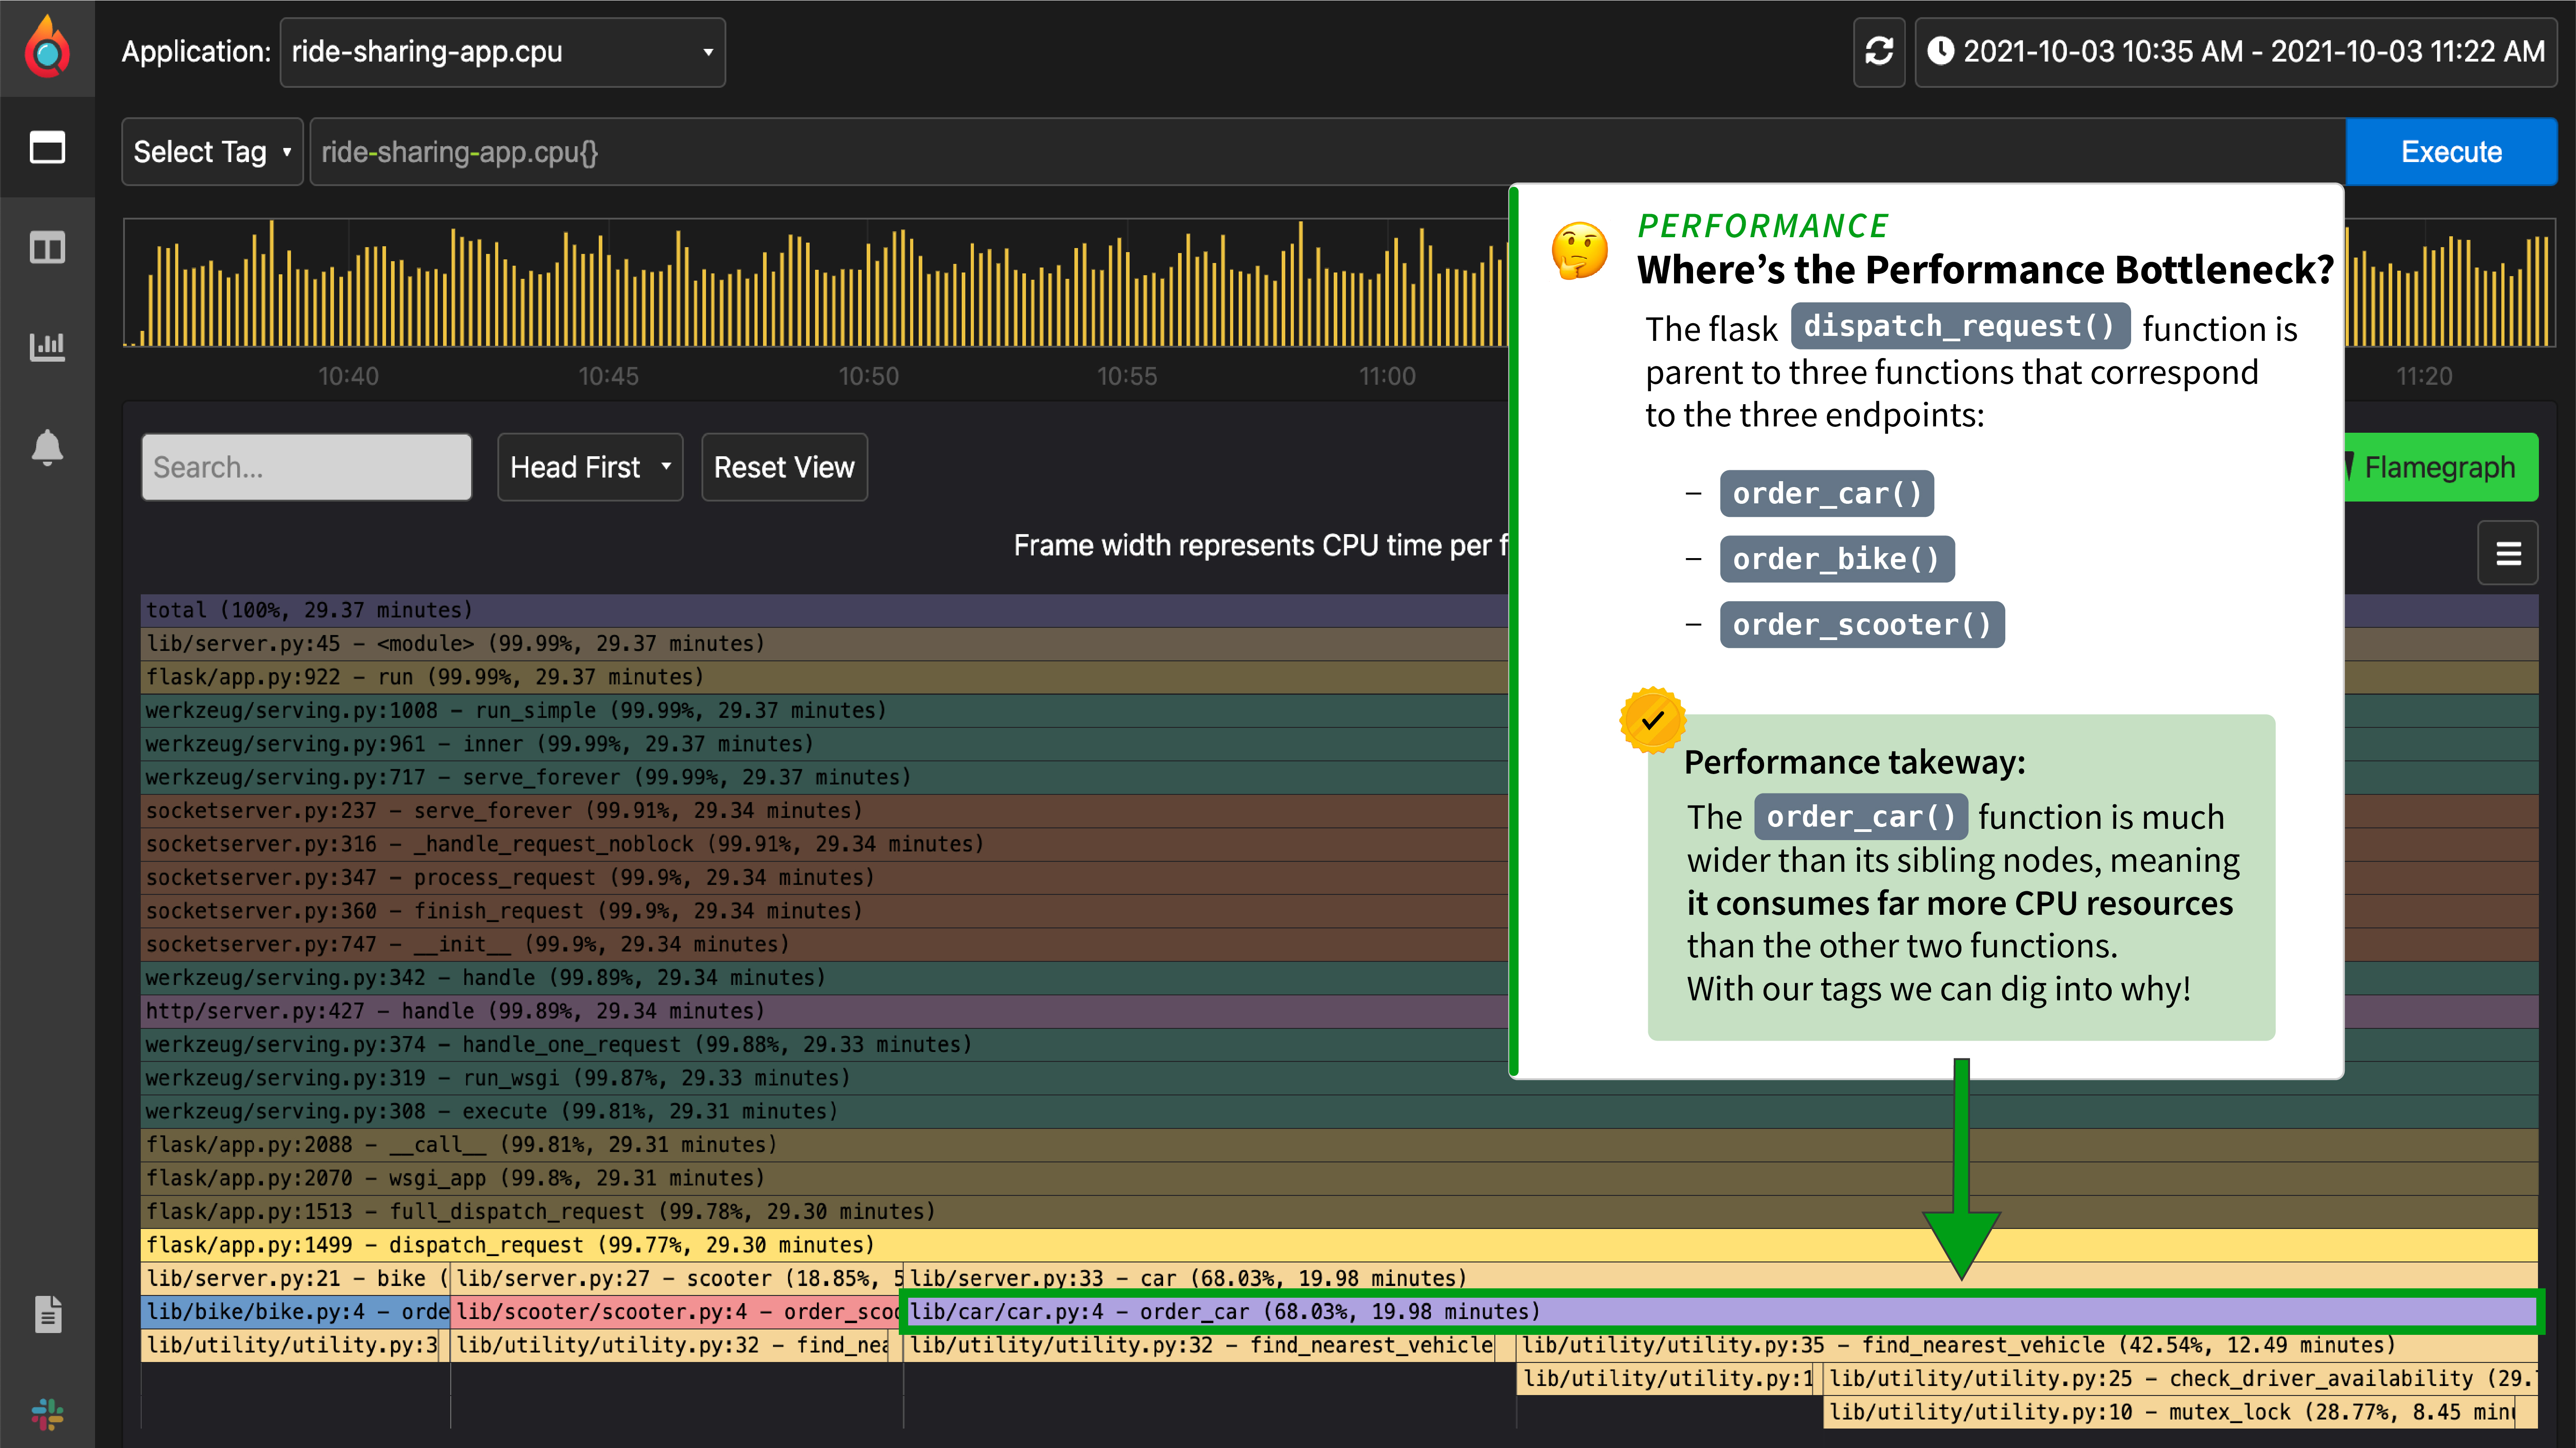
The first step when analyzing a profile outputted from your application, is to take note of the largest node which is where your application is spending the most resources. In this case, it happens to be the order_car function.
The benefit of using the Pyroscope package, is that now that we can investigate further as to why the order_car() function is problematic. Tagging both region and vehicle allows us to test two good hypotheses:
- Something is wrong with the
/carendpoint code - Something is wrong with one of our regions
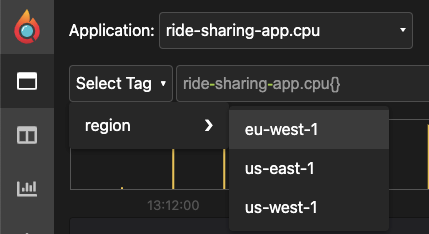
To analyze this we can select one or more tags from the "Select Tag" dropdown:
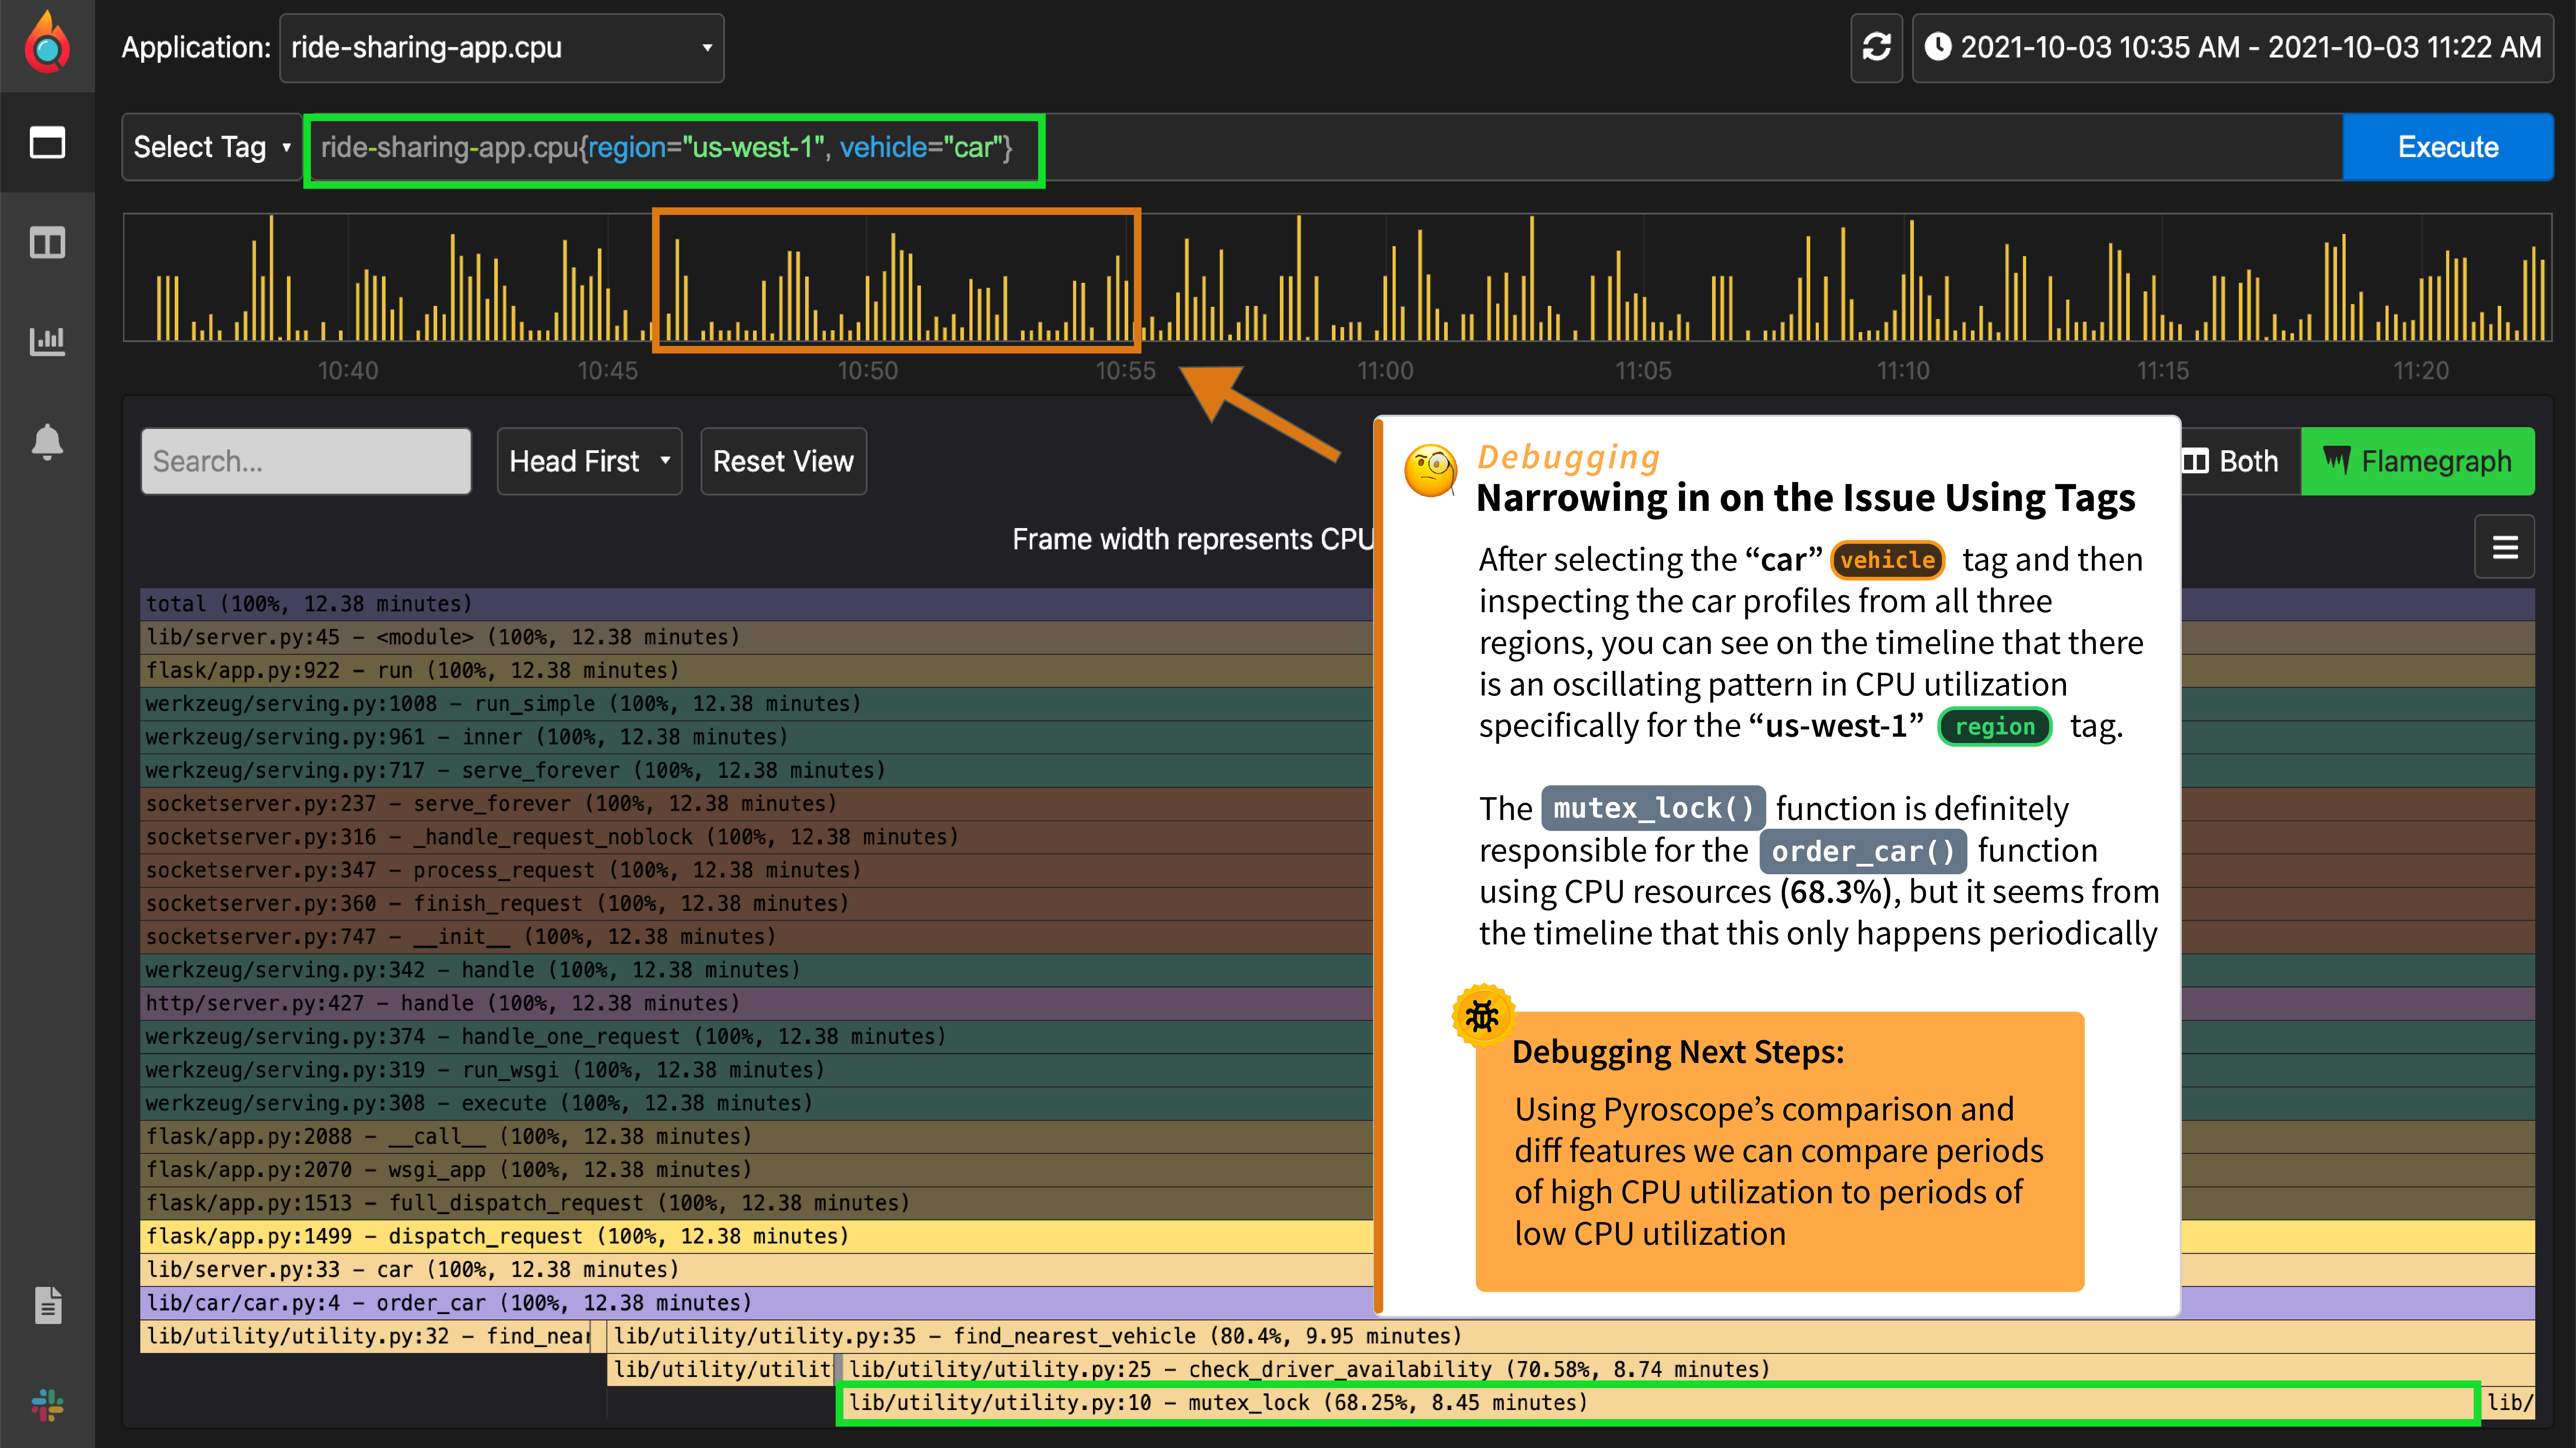
Narrowing in on the Issue Using Tags#
Knowing there is an issue with the order_car() function we automatically select that tag. Then, after inspecting multiple region tags, it becomes clear by looking at the timeline that there is an issue with the us-west-1 region, where it alternates between high-cpu times and low-cpu times.
We can also see that the mutex_lock() function is consuming almost 70% of CPU resources during this time period.
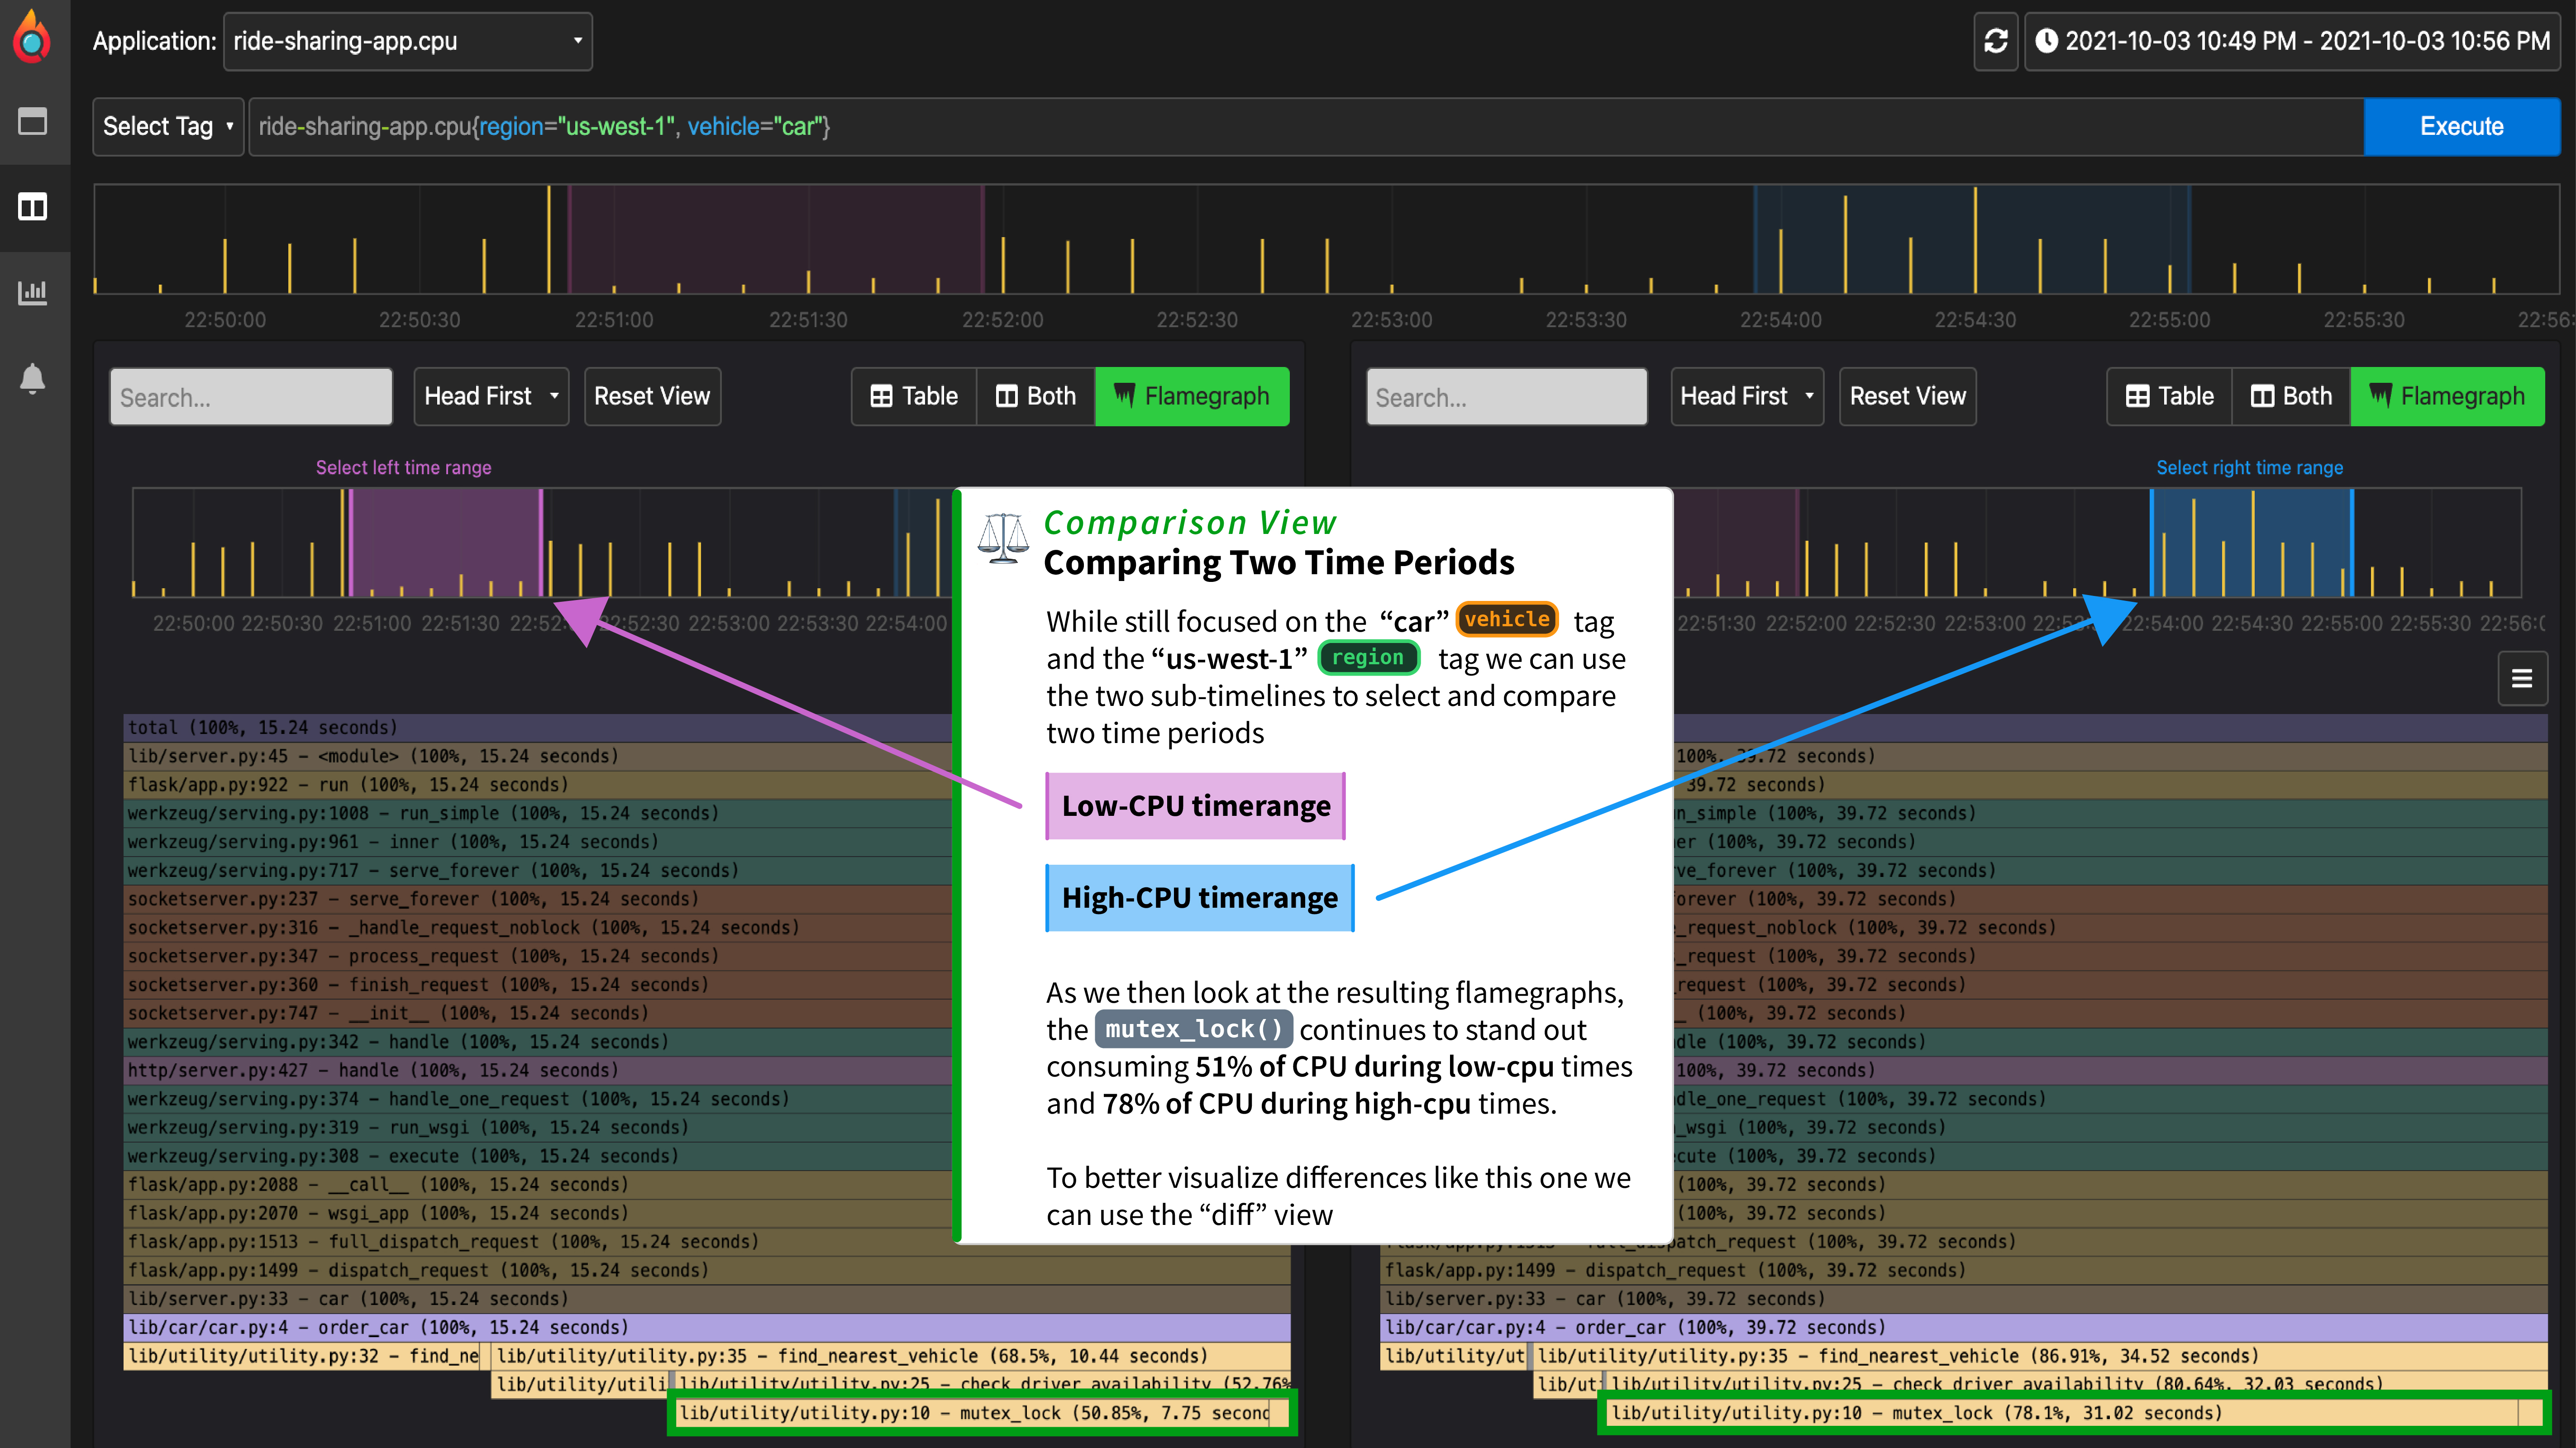
Comparing two time periods#
Using Pyroscope's "comparison view" we can actually select two different time ranges from the timeline to compare the resulting flamegraphs. The pink section on the left timeline results in the left flamegraph, and the blue section on the right represents the right flamegraph.
When we select a period of low-cpu utilization and a period of high-cpu utilization we can see that there is clearly different behavior in the mutex_lock() function where it takes 51% of CPU during low-cpu times and 78% of CPU during high-cpu times.
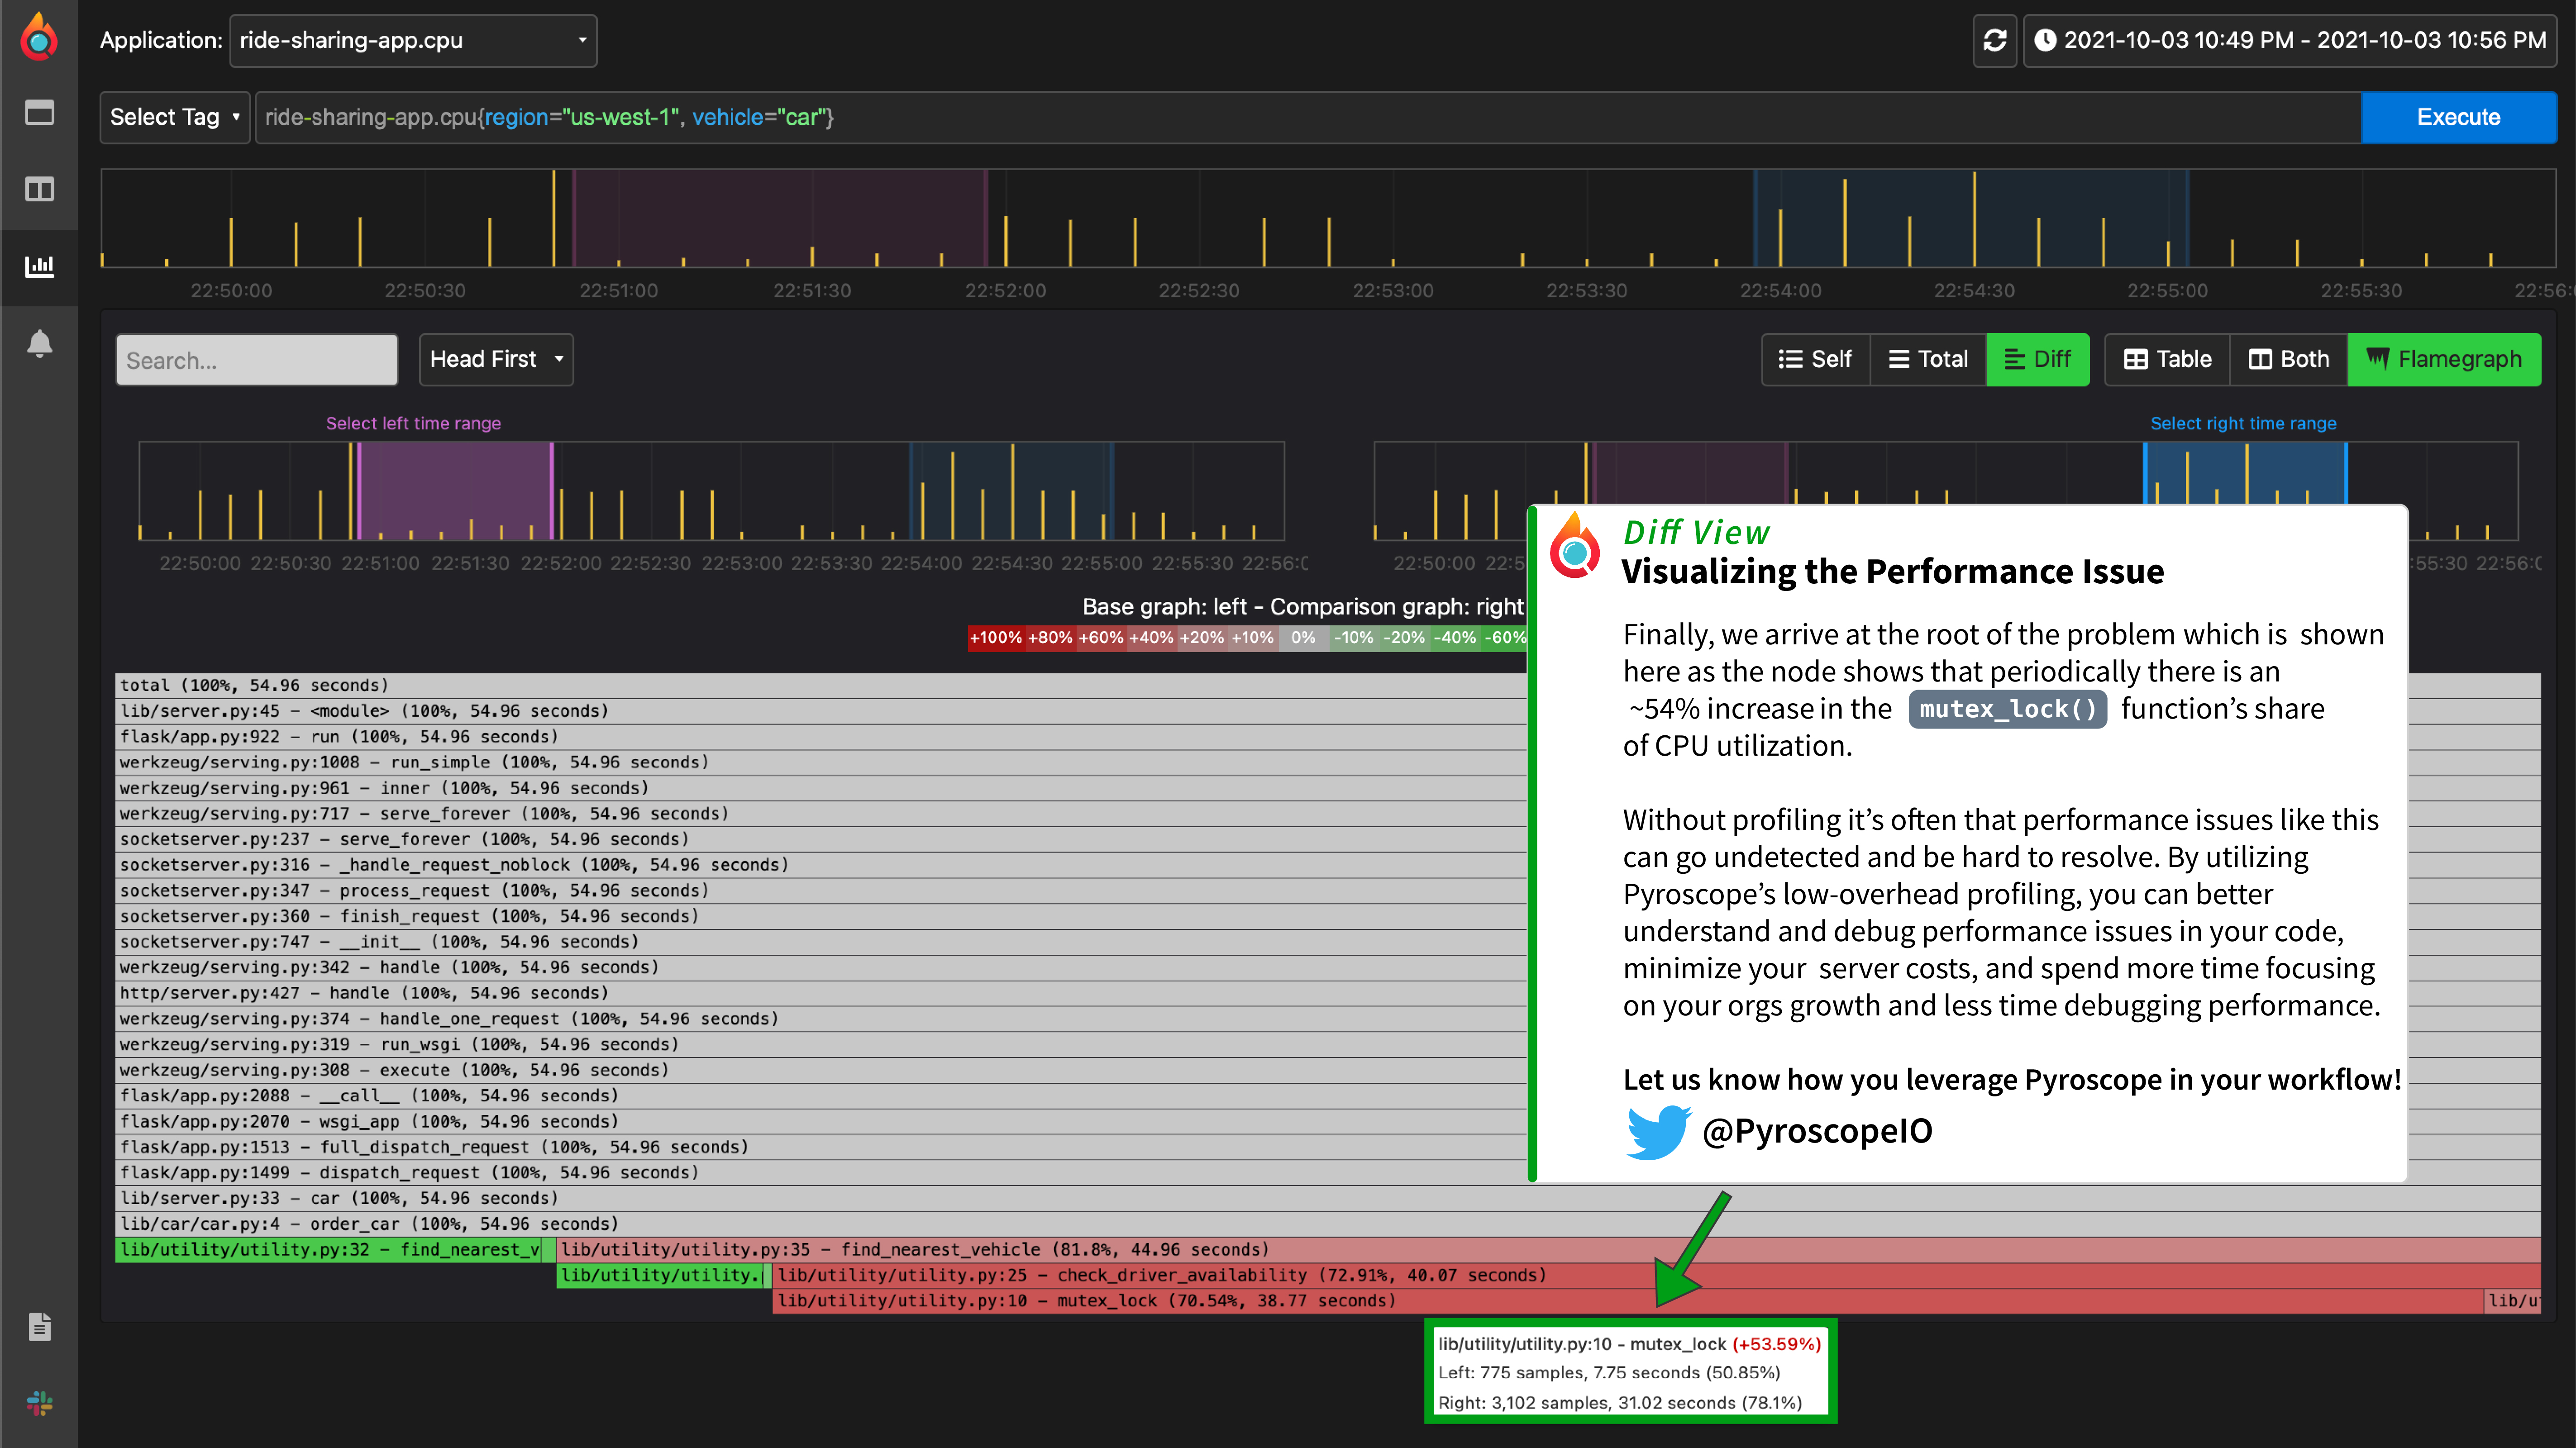
Visualizing Diff Between Two Flamegraphs#
While the difference in this case is stark enough to see in the comparison view, sometimes the diff between the two flamegraphs is better visualized with them overlayed over each other. Without changing any parameters, we can simply select the diff view tab and see the difference represented in a color-coded diff flamegraph.
More use cases#
We have been beta testing this feature with several different companies and some of the ways that we've seen companies tag their performance data:
- Tagging controllers
- Tagging regions
- Tagging jobs from a redis / sidekiq / rabbitmq queue
- Tagging commits
- Tagging staging / production environments
- Tagging different parts of their testing suites
- Etc...
Future Roadmap#
We would love for you to try out this example and see what ways you can adapt this to your python application. Continuous profiling has become an increasingly popular tool for the monitoring and debugging of performance issues (arguably the fourth pillar of observability).
We'd love to continue to improve this pip package by adding things like integrations with popular tools, memory profiling, etc. and we would love to hear what features you would like to see.