
Grafana Pyroscope data source
Grafana Pyroscope is a horizontally scalable, highly available, multi-tenant, OSS, continuous profiling aggregation system. Add it as a data source, and you are ready to query your profiles in Explore.
Refer to Introduction to Pyroscope to understand profiling and Pyroscope.
To use profiling data, you should:
- Configure your application to send profiles
- Configure the Grafana Pyroscope data source.
- View and query profiling data in Explore
Integrate profiles into dashboards
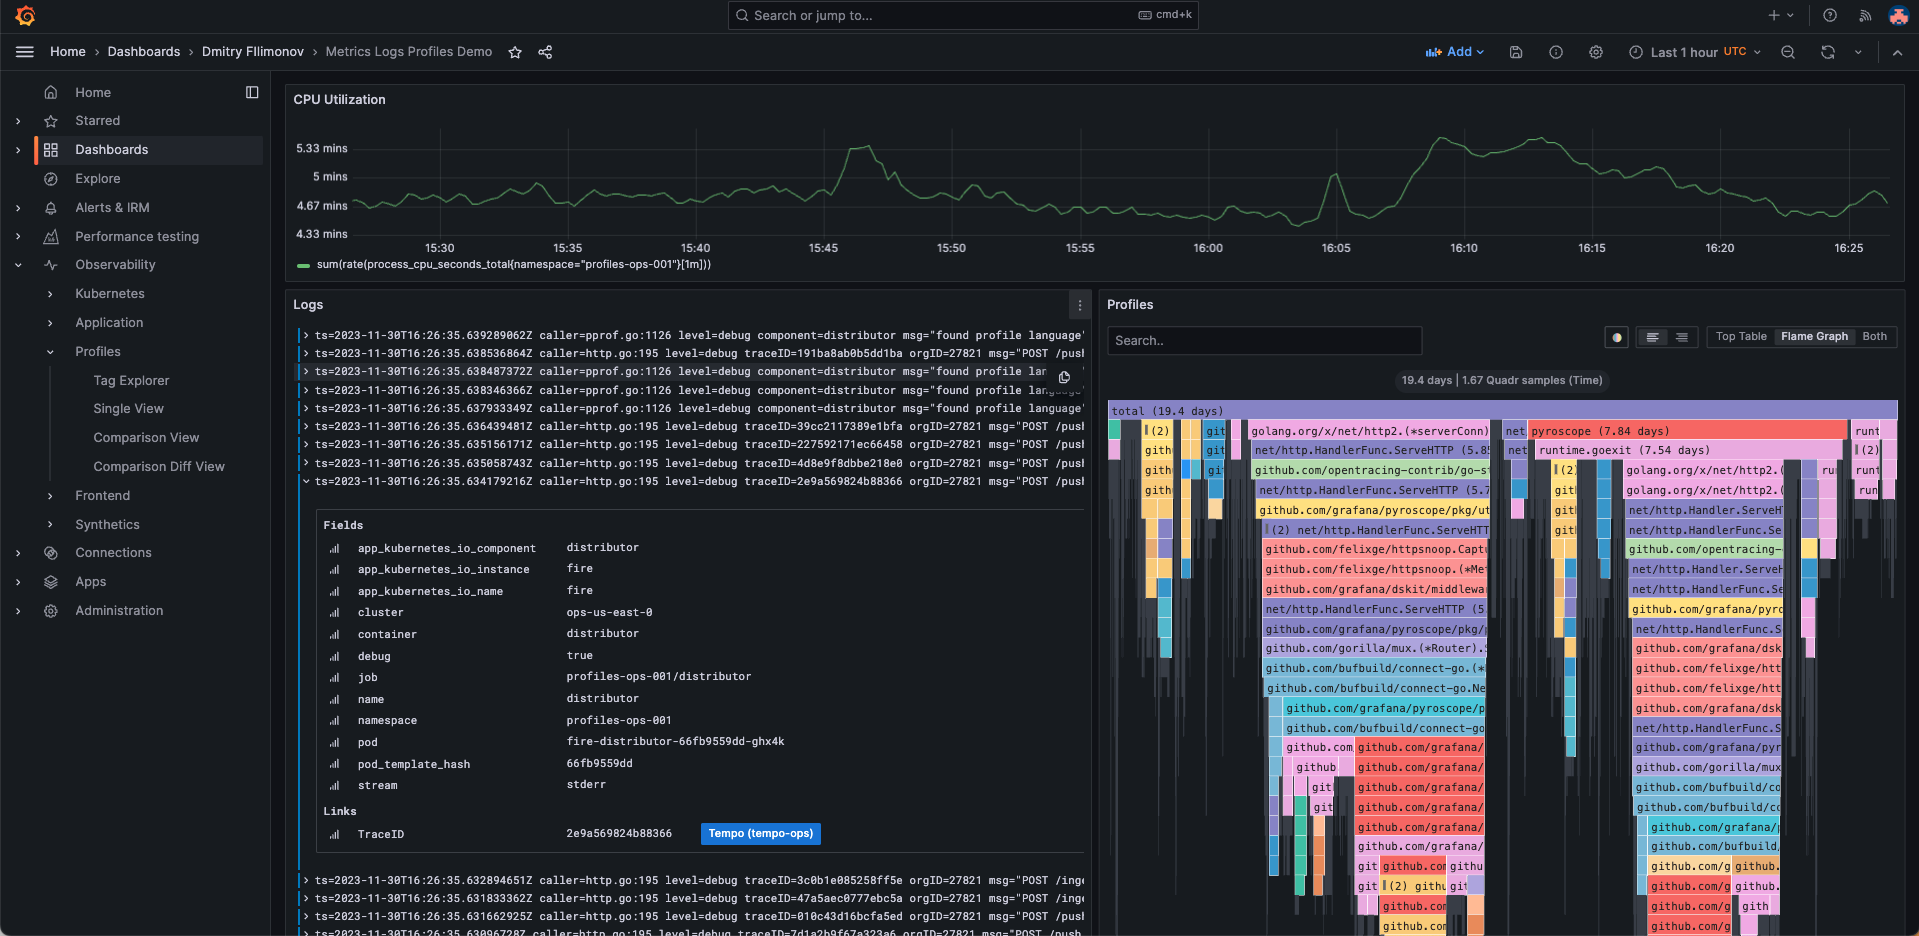
Using the Pyroscope data source, you can integrate profiles into your dashboards. In this case, the screenshot shows memory profiles alongside panels for logs and metrics to be able to debug out of memory (OOM) errors alongside the associated logs and metrics.
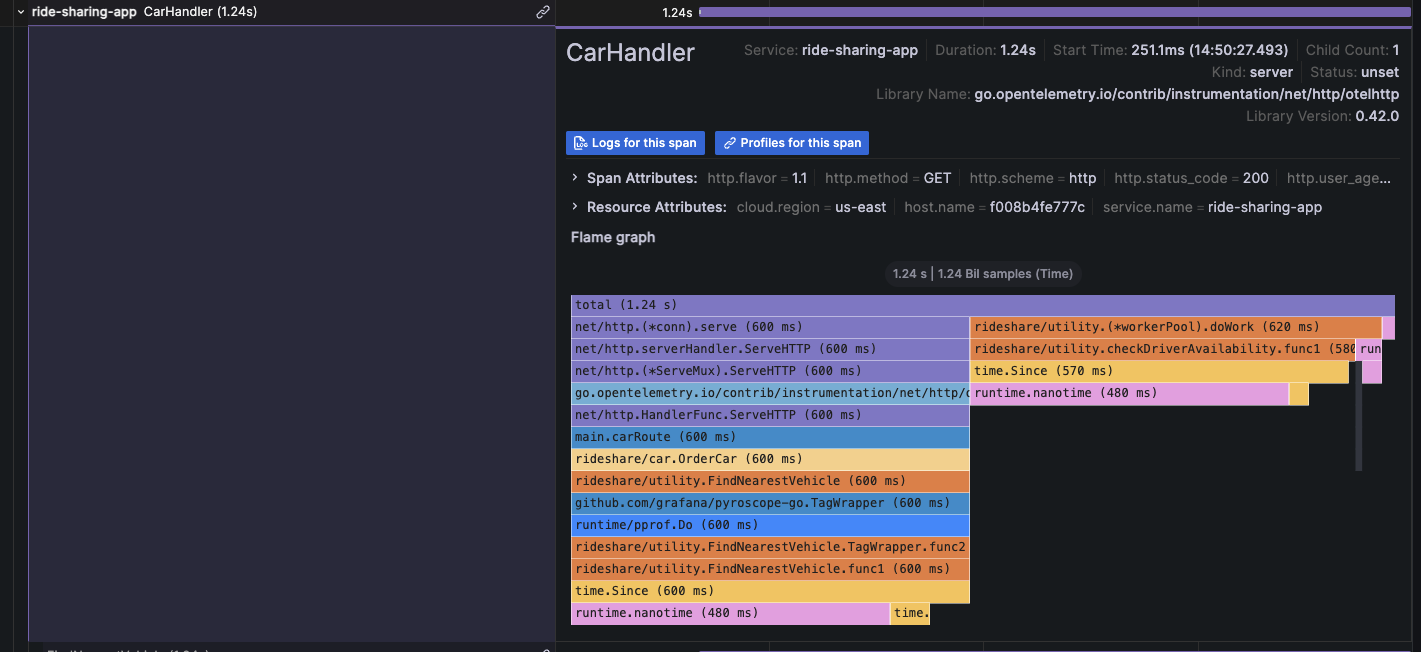
Visualize traces and profiles data using Traces to profiles
You can link profile and tracing data using your Pyroscope data source with the Tempo data source. To learn more about how profiles and tracing can work together, refer to Profiling and tracing synergies.
Combined traces and profiles let you see granular line-level detail when available for a trace span. This allows you pinpoint the exact function that’s causing a bottleneck in your application as well as a specific request.
For more information, refer to the Traces to profile section and Link tracing and profiling with span profiles.
Provision the Grafana Pyroscope data source
You can modify the Grafana configuration files to provision the Grafana Pyroscope data source. To learn more, and to view the available provisioning settings, refer to provisioning documentation.
Here is an example configuration:
apiVersion: 1

datasources:
  - name: Grafana Pyroscope
    type: grafana-pyroscope-datasource
    url: http://localhost:4040
    jsonData:
      minStep: '15s'
Was this page helpful?
Related resources from Grafana Labs


